Observability Cost Explosion: Why Your Datadog and Splunk Bills Are Out of Control in 2026
Key Takeaways
- Observability spend now exceeds compute spend at a measurable share of mid-sized SaaS and fintech firms. Industry surveys in early 2026 put the observability line item at 15 to 25 percent of total cloud spend for the worst-affected segment, with several public examples of single-vendor invoices crossing eight figures annually.
- The pricing models are designed to obscure the real cost driver. The cost driver is rarely raw log volume. It is high-cardinality custom metrics (a metric tagged with user ID or transaction ID can multiply into hundreds of millions of time series), per-host indexing on dynamic workloads, and ingestion-tier traps where the cheap tier silently routes to the expensive one.
- The vendor landscape splits four ways: Datadog (broadest product surface, highest per-host bill), Splunk (logs-first incumbent, brittle license model), New Relic (priced by user not by data, attractive for steady state), Grafana Cloud (OpenTelemetry-native, lower per-unit cost), and the self-hosted OpenTelemetry plus open-source backend pattern (lowest per-unit cost, highest operational cost).
- Three optimization plays actually move the bill: tier routing (send the hot data to the expensive tier, the warm data to the cheap tier, the cold data to object storage), cardinality budgets (cap and enforce custom-metric tag explosion at the application code), and sample-then-aggregate (trace sampling plus pre-aggregated metrics replacing raw events).
- The decision is rarely which vendor to standardize on. It is which workloads belong in the premium tier of which vendor and which workloads belong on a cheaper stack. Treating observability as a single line item is the framing that produced the explosion in the first place.
The Observability Cost Problem
The observability bill snuck up on most companies. In 2020 a Datadog or Splunk invoice was visible but not painful, a Grafana stack was free, and the trade-off looked obvious: pay the vendor, get the dashboards, ship the product. By 2024 the same vendors were the second or third largest line item in the cloud bill at many fintech and SaaS companies. By 2026 several public earnings releases and industry surveys put the observability line at 15 to 25 percent of total cloud spend for the worst-affected segment.
The drivers were three. Cloud-native workloads (Kubernetes, microservices, event-driven architectures) multiplied the number of hosts, containers, and processes that observability vendors meter against. Custom metrics tagged with high-cardinality dimensions (user ID, request ID, customer ID, region by tenant) exploded the number of time series stored. And the AI workload buildout added a fourth data type (token usage, prompt content, embedding latency) that vendors metered at the same premium rates as production telemetry.
The vendor pricing models did the rest. Per-host pricing on dynamic Kubernetes workloads where pod counts spike during deployments. Per-time-series pricing on metrics where a single application change can create millions of new series overnight. Per-gigabyte log pricing where structured logs at debug verbosity ingest at orders of magnitude faster than expected. None of these traps are hidden in the contract. All of them are hidden in the architecture decisions the engineering team makes long before the finance team sees the invoice.
The starting point for the executive conversation is that observability is no longer a vendor selection problem. It is a cloud cost discipline problem that happens to involve a specific vendor surface. The same framing applies that holds for cloud computing cost decisions broadly and for the hidden costs of AI infrastructure.
Where the Money Actually Goes
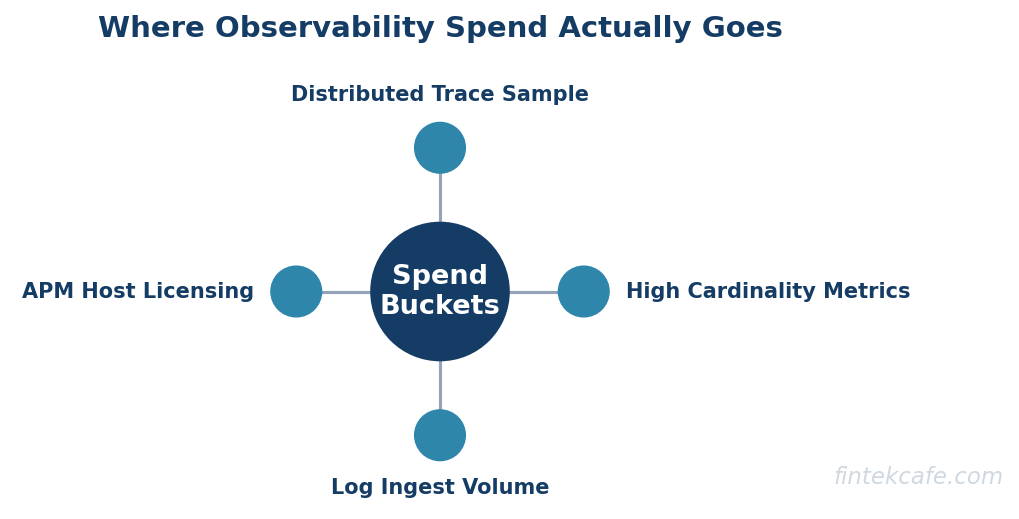
A clean diagnosis starts by separating four cost categories. Most invoices roll these together and most finance teams cannot decompose them without a vendor-specific cost report.
Metrics. Time-series data points (CPU, latency, custom application metrics) ingested and stored. The cost driver is unique time series count, not raw data volume. A metric named "request_latency" with tags for region, service, and status code produces a handful of time series. The same metric with tags for user ID and transaction ID can produce hundreds of millions.
Logs. Structured and unstructured log events ingested, parsed, indexed, and retained. The cost driver is the indexing tier, not the storage. A log line that lands in the searchable index costs hundreds of times more than the same line in cold object storage.
Traces. Distributed trace spans capturing the path of a request through the service graph. The cost driver is the sampling rate. Full-fidelity tracing on every request is operationally and financially infeasible at scale; head-based and tail-based sampling become the controls.
Real-user monitoring and synthetic. Browser and mobile telemetry plus synthetic probes. Often priced per session or per monitor. The cost can grow with traffic in ways that the engineering team does not predict.
Of these four, custom metrics with high-cardinality tags are the most common surprise. A single new tag on a popular metric can add seven figures to an annual invoice. The metric itself is innocuous; the engineering team had no reason to expect a cost outcome from adding a tag.
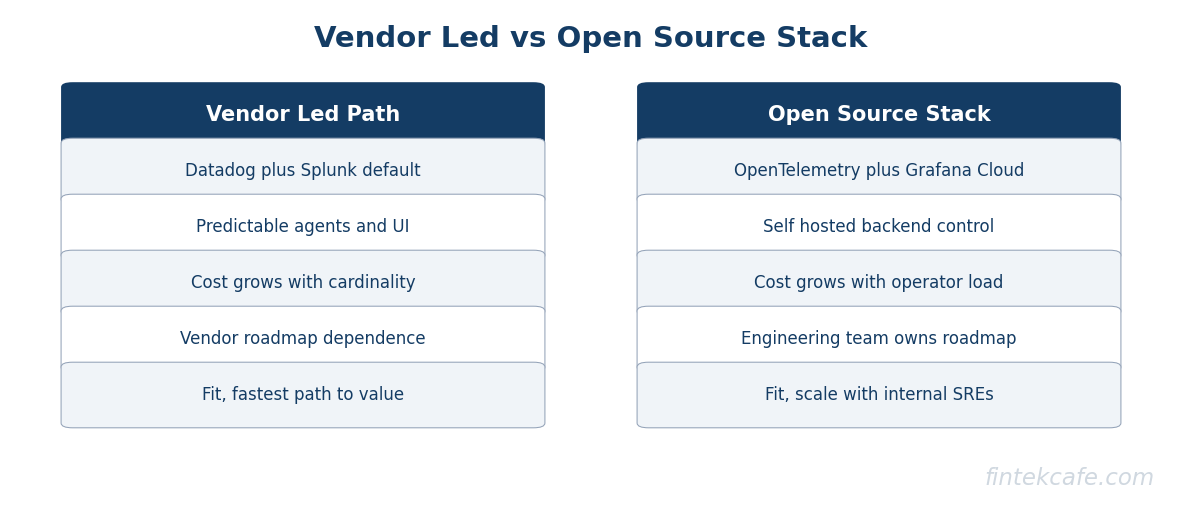
The Vendor Landscape in 2026
Four product positions dominate, with a fifth pattern emerging for cost-sensitive workloads.
Datadog
The broadest product surface in observability: metrics, logs, traces, RUM, synthetics, security, APM, infrastructure, plus a growing set of AI observability products. The buying argument is the integrated experience and the depth of integrations. The bill argument is that every product is metered separately, with per-host base pricing layered on top.
The trap is the seductive pattern of enabling another SKU. A team that was on Infrastructure and APM adds Logs because the integration is one click. Then RUM. Then Synthetics. Each addition is justified individually. The aggregate is the invoice that makes the CFO ask hard questions in Q3.
Splunk
The logs-first incumbent. The buying argument is that Splunk's search performance on large log volumes remains best-in-class and the SIEM and security use cases are deeply established. The bill argument is the perpetual license model layered with ingestion-volume pricing that does not flex down when the team optimizes.
Splunk's recent Cisco acquisition has not yet meaningfully changed the pricing posture for existing customers. Migration off Splunk for security workloads remains the hardest of the four vendors because the SIEM rules, the analyst training, and the compliance integrations are all Splunk-shaped.
New Relic
Priced by user rather than by data volume since the 2020 model shift. The buying argument is predictable cost at steady state: a fixed number of users, an unlimited amount of data within the included tier. The bill argument is that the included data tier is finite and overages can be expensive.
New Relic is the vendor whose pricing model most directly disincentivizes cardinality explosion (since the team is not paying per time series), which makes it attractive for companies whose pain is metrics cardinality rather than log volume.
Grafana Cloud
OpenTelemetry-native, built on the open-source LGTM stack (Loki for logs, Grafana for visualization, Tempo for traces, Mimir for metrics). The buying argument is lower per-unit cost than the closed-source incumbents and an upgrade path to self-hosting if costs scale. The bill argument is that the platform is less opinionated; teams that want a turnkey experience have to do more configuration work.
Grafana Cloud is the most common destination for teams migrating off Datadog for cost reasons. The cost reduction is real (industry reports cite 40 to 70 percent reductions for migrating workloads, with caveats), but the migration cost is meaningful and the day-two operational work is higher.
OpenTelemetry plus Self-Hosted Backend
For mature teams, the pattern is to instrument with OpenTelemetry (the open standard for telemetry collection) and ship the data to a self-hosted backend (Loki, Prometheus, ClickHouse, or a managed service like Honeycomb for traces). The buying argument is per-unit cost at the floor and full control over data retention, sampling, and routing. The bill argument is the operational team required to run the stack.
This pattern is the right answer for companies above a certain scale where the operational team exists as a fixed cost and the per-unit savings amortize across the scale. Below that scale, the operational cost exceeds the SaaS savings.
| Pattern | Cost per unit | Operational cost | Best fit |
|---|---|---|---|
| Datadog | High | Low | Teams that want one integrated vendor and accept the bill |
| Splunk | High | Moderate | Logs-heavy and security-heavy workloads with established Splunk muscle |
| New Relic | Predictable per-user | Low | Steady-state workloads where data volumes are bounded |
| Grafana Cloud | Moderate | Moderate | OpenTelemetry-first teams migrating off premium vendors |
| OpenTelemetry plus self-hosted | Low | High | Mature platforms with a dedicated observability team |
The matrix is a starting point. The right answer is rarely a single vendor across the whole platform.
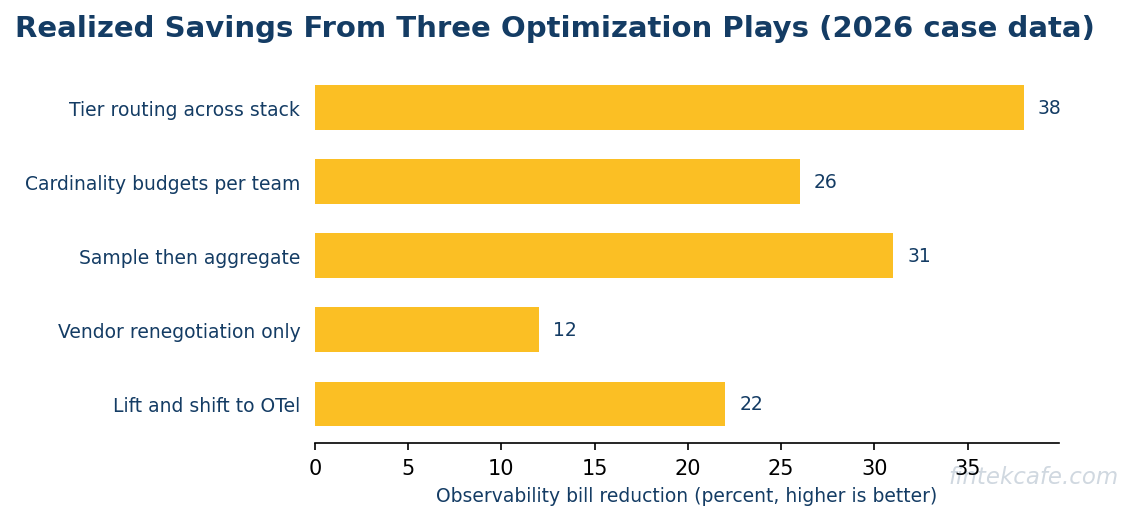
Three Optimization Plays That Actually Work
Most cost-reduction projects start with the wrong question: "which vendor is cheaper." The right question is "which workloads should be on which tier of which vendor." Three plays move the bill in measurable ways.
Play One: Tier Routing
The cheapest observability data is data that never reached the expensive tier. Tier routing moves data through a pipeline that decides what lands in the premium search index, what lands in a cheaper analytics tier, and what lands in object storage.
A common architecture uses a pipeline tool (Vector, Cribl, Fluent Bit, OpenTelemetry Collector) in front of the vendor. The pipeline parses the data, applies routing rules, and forwards. Production access logs land in the searchable index for a week, then move to a cheaper tier for thirty days, then archive to object storage for the compliance retention period. Debug-level logs from development environments never leave the cheaper tier. Per-request trace payloads sample at 1 percent in production and 100 percent in staging.
The cost reduction is meaningful (often 30 to 50 percent on logs alone) and the engineering effort is moderate. The pattern requires that the team can defend the routing decisions during an incident, which is the part that takes practice.
Play Two: Cardinality Budgets
The single most expensive surprise in metrics pricing is a tag explosion. A custom metric tagged with user ID is the canonical case: one tag value per user means one time series per user, which can run to millions or hundreds of millions.
Cardinality budgets push the discipline into the application code. Each service has a defined budget for total time series. New tags require review. The metrics SDK enforces the budget at runtime by dropping or aggregating tags above a threshold. The platform team can identify the metrics that drive the highest cost and either reshape them or escalate.
Implementing this in a codebase already in production is painful. Implementing it as a discipline for new metrics is much cheaper and produces a permanent ceiling on the surprise. Teams that have a mature DevOps practice and a strong platform-engineering function find the discipline easier to enforce.
Play Three: Sample Then Aggregate
Full-fidelity telemetry on every event is operationally and financially infeasible at production scale. Sampling at ingestion (head-based or tail-based) and pre-aggregating metrics before they reach the vendor cuts cost by orders of magnitude.
The shape that works for most workloads: tail-based sampling on traces (keep all error traces, sample successful traces at a low rate), pre-aggregated metrics for the high-volume dimensions (the dashboards that show p99 latency by region by status code do not need raw events), and structured-log aggregation for high-frequency events (rate-limit log lines at the source).
The trade-off is that the lost data is genuinely lost. A team that needs to reconstruct a single user's full session a month after the fact cannot do so with sampling at 1 percent. The discipline is to know which workloads need full fidelity and pay for it, and which workloads do not and stop paying for it.
A Decision Framework: Optimize, Switch, or Layer
The choice between optimizing the current vendor and switching has four inputs.
Input one: How much of the bill is structural? If 80 percent of the bill is one or two cost drivers that can be addressed in the application or the pipeline (cardinality, debug-logging volume, sampling), optimization is faster and cheaper than migration. If the bill is broadly distributed across categories with no single driver, migration may be the only path.
Input two: What is the migration cost? Splunk migrations are the most expensive because of SIEM rules, compliance integrations, and analyst training. Datadog migrations are moderately expensive because the integrations and dashboards run deep. Grafana migrations are moderate. New Relic migrations are lighter because the data volumes are usually capped at contract.
Input three: What is the operational maturity of the team? Self-hosting observability requires a team that can operate the stack. Below a certain scale that team is a fixed cost the company cannot justify. Above that scale the self-hosting cost amortizes.
Input four: Where is the company on the cost curve? A company at 5 percent of cloud spend on observability has room to optimize the current vendor. A company at 25 percent of cloud spend needs to assume migration is on the table, run a real cost model on alternatives, and commit to a year of engineering effort. A company headed past 25 percent without a plan has a board-level conversation in its near future. The executive view on cloud costs frames the same dynamic.
What This Means for Engineering Leadership in 2026
The observability cost explosion is not a vendor problem. It is a discipline problem dressed up as a vendor problem. Teams that treat observability as a single line item, leave cardinality enforcement to engineer judgment, and stand up new SKUs without a cost model produce the eight-figure invoices. Teams that treat observability as a portfolio (multiple tools, multiple tiers, explicit cost ownership) hold the bill flat through scale.
The right question for the next quarterly review is not whether the team is using Datadog or Grafana. It is whether anyone in engineering can produce a chart that shows cost per data type, cost per service, and cost per business outcome. If those charts do not exist, the cost discipline does not exist either, and the bill will keep growing.
FAQ
Why are observability bills growing faster than infrastructure bills?
Three reasons. Cloud-native architectures multiplied the host and process counts that observability vendors meter against. High-cardinality custom metrics let engineering teams create cost outcomes by adding tags that look harmless. And vendor pricing models bundle multiple SKUs that get enabled one at a time, each justified individually, with the aggregate invisible until the annual renewal.
Is migrating from Datadog to Grafana Cloud worth it?
For workloads above a certain scale where the per-unit cost difference dominates the migration cost, yes. Industry reports cite 40 to 70 percent reductions in line-item cost for migrating workloads. The migration takes six to twelve months for a meaningful portion of an enterprise estate and the day-two operational work is higher. Below the scale threshold, optimizing the existing Datadog footprint is usually faster.
What is the single highest-impact optimization for an observability bill?
Cardinality control on custom metrics. A single tag explosion can add seven figures annually. Implementing a cardinality budget at the SDK level prevents the problem permanently. Tier routing for logs is the second-highest impact, often 30 to 50 percent reduction with moderate engineering effort.
Is OpenTelemetry ready to replace vendor agents?
For metrics, logs, and traces, yes. The OpenTelemetry collectors and SDKs are mature and supported by every major vendor. The transition from vendor agents to OpenTelemetry instrumentation is the foundational move that unlocks pipeline routing, vendor portability, and self-hosting options.
Should we self-host observability?
Only if there is a platform team that can operate the stack. Self-hosted Loki, Prometheus, Mimir, and Tempo deliver the lowest per-unit cost in observability. The operational cost is non-trivial. For organizations above the scale where the team is a fixed cost regardless, self-hosting amortizes. For smaller organizations, the SaaS premium is still cheaper than the operational overhead.
Related reading on FinTekCafe
- The Real Cost of AI Infrastructure (Pro)
- Cloud Computing Explained: What Every Business Leader Needs to Know
- The Cloud Cost Crisis: Why Your AWS Bill Is a Strategy Problem
- Cloud Economics for AI Workloads: What Executives Get Wrong
- DevOps Explained: How Modern Companies Build and Ship Software
- Executive Guide to Cloud Costs: When the Bill Is Too High
Related Articles
Legacy System Modernization: Strategies That Do Not Blow Up
A leader's guide to legacy modernization: the real triggers, the strategy ladder with honest costs, the strangler-fig default, and what AI changes.
Sovereign Cloud: The Compliance Product Hyperscalers Love to Sell
Sovereign cloud is a pricing tier more than a technology. What the offerings deliver versus imply, who needs which layer, and when the premium is worth paying.
Disaster Recovery Planning: What Technology Leaders Actually Need
Disaster recovery for technology leaders: RTO and RPO tiering, the four DR architecture patterns with honest cost multiples, testing, and cloud-era failures.