
LLM Observability: How to Monitor AI Systems in Production
LLM observability is the discipline of instrumenting AI systems so that quality, cost, and behavior are as visible as uptime, because for an LLM feature, uptime is the signal least likely to fail. Traditional application monitoring answers whether a service is up, fast, and error-free, and an LLM feature can be all three while confidently returning worse answers than it did last week. The gap has a specific shape: model outputs are non-deterministic, there is no ground truth to check a response against at request time, cost varies per request rather than per server, and quality moves when a prompt, a model version, or the input mix changes, none of which throws an exception. Most teams discover this the expensive way, when a silent regression reaches customers and nobody can say when it started, what changed, or which requests it affected. LLM observability exists so that question has an answer.
Key Takeaways
- Classic APM watches for failures that announce themselves: errors, latency, saturation. LLM failures do not announce themselves; a degraded model returns HTTP 200 with a worse answer. Monitoring must therefore include signals about output quality, not just service health.
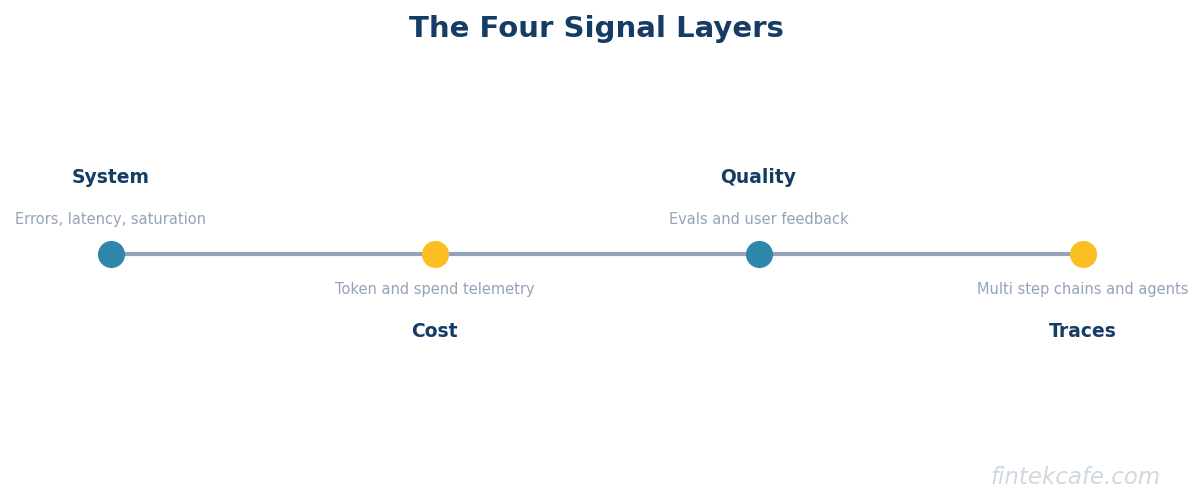
- Production LLM systems need four signal layers: system metrics that classic tooling already covers, token and cost telemetry, quality signals from automated evaluation and user feedback, and trace-level records of multi-step chains and agent runs. Most teams have layer one and discover they need the other three after an incident.
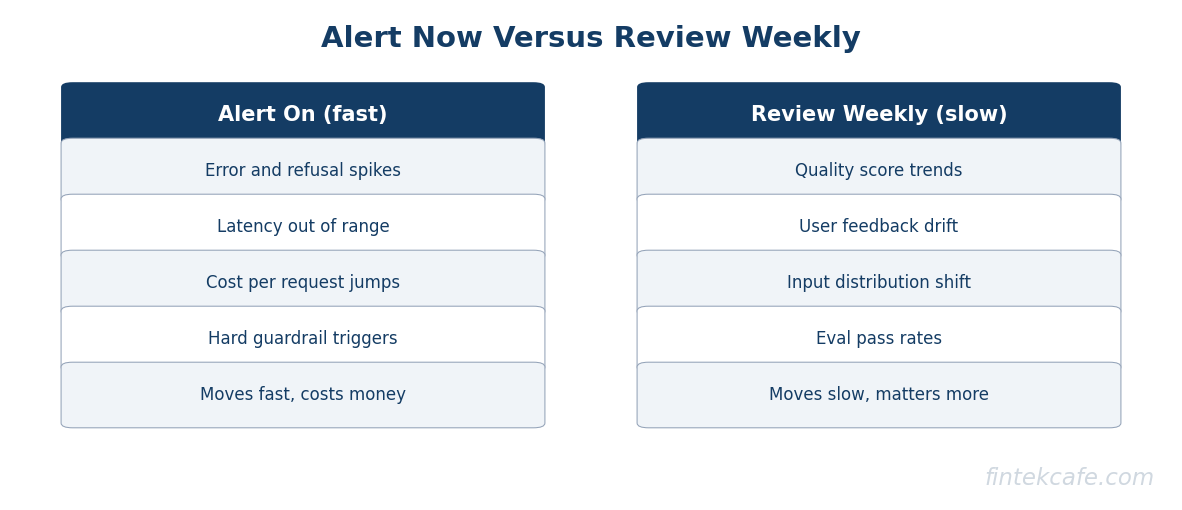
- Alert on the signals that move fast and cost money: error and refusal spikes, latency, cost per request, and hard guardrail triggers. Review weekly the signals that move slowly and matter more: quality scores, feedback trends, and input drift. Alerting on slow signals produces noise; reviewing fast signals weekly produces outages.
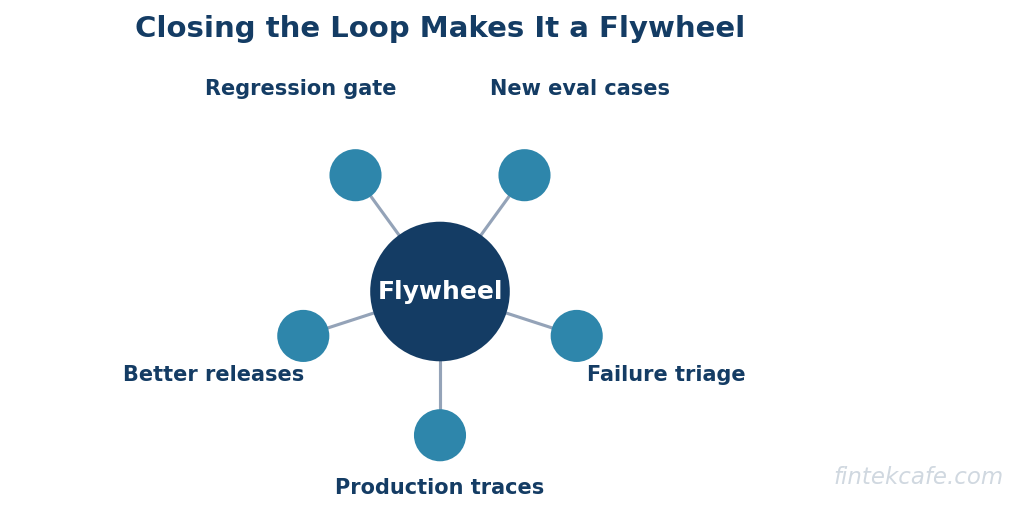
- The highest-leverage practice is closing the loop: every production failure becomes a case in the evaluation suite, so the same regression cannot ship twice. Observability without this loop is a dashboard; with it, it is a quality flywheel.
- Buy or adopt the platform layer early and spend engineering time on what vendors cannot supply: task-specific quality metrics, evaluation datasets, and the discipline of reviewing traces. Tooling choice matters far less than whether anyone looks.
Why Classic Monitoring Misses LLM Failures
The monitoring stack most organizations run was built for deterministic software, and every assumption it encodes breaks somewhere on an LLM workload.
Non-determinism removes the baseline. Classic monitoring works by comparing behavior to a known-good baseline: this endpoint returns this shape, this job takes this long. An LLM returns different output for identical input by design, so "different from yesterday" is not an anomaly, and naive diffing produces pure noise. The observable unit has to shift from the individual response to the distribution of responses: refusal rates, output lengths, format-validity rates, score distributions.
There is no ground truth at request time. When a payment fails, the system knows. When an LLM answer is subtly wrong, nothing in the request path knows, the user may not know, and the application logs a success. Correctness has to be estimated after the fact, by sampled automated evaluation, by downstream signals such as whether the user accepted or edited or retried, and by human review of samples. That estimation machinery is precisely what a classic APM product does not contain; building it as a reusable harness is covered in the enterprise guide to LLM evaluation.
Cost is a first-class signal, not a finance report. Conventional services have costs that scale with infrastructure and change slowly. LLM costs are metered per token and can multiply overnight: a prompt edit that doubles context, a retry loop triggered by a malformed-output bug, an agent that starts taking twelve steps where it took four. Organizations that already struggle to attribute conventional observability spend, a problem examined in the observability cost analysis of Datadog and Splunk pricing, find LLM spend both spikier and easier to attribute, provided token telemetry is captured per request with feature and customer dimensions from day one.
Versions drift in three dimensions. A conventional deployment changes when the code changes. LLM behavior changes when the code changes, when the prompt changes, when the retrieved context changes, and when the provider updates or retires the model underneath the API. A quality incident cannot be diagnosed without knowing which prompt version, model version, and retrieval configuration served each request, which means those identifiers must be recorded on every trace as deliberately as a build number.
The Four Signal Layers
A production-grade LLM observability practice is four layers, stacked from what existing tooling already covers to what almost no team has until it hurts.
| Layer | What it captures | What good looks like |
|---|---|---|
| 1. System metrics | Availability, latency, error rates, throughput, provider status | Already covered by existing APM; latency tracked per model and endpoint, including time-to-first-token for streaming |
| 2. Token and cost telemetry | Input/output tokens, cost per request, cost per feature and customer, retry and cache rates | Every request tagged with feature, model, prompt version; cost anomalies visible within hours, attributable in one query |
| 3. Quality signals | Automated eval scores on sampled traffic, guardrail triggers, refusal rates, format validity, user feedback and behavioral signals | Scored sample runs continuously; a quality dashboard trend exists per feature; regressions visible within a day, not a quarter |
| 4. Traces | Full record of multi-step chains and agent runs: every model call, tool call, retrieval, intermediate output, with prompt/model/config versions | Any user-reported bad output can be replayed end to end; slowest and costliest steps of a chain are identifiable per request |
Layer one is table stakes and mostly already exists; the only LLM-specific additions are per-model latency and streaming metrics such as time-to-first-token, which drives perceived responsiveness more than total duration does.
Layer two is where most teams start seeing surprises. Token telemetry per request, dimensioned by feature, model, prompt version, and customer, turns the invoice from a monthly shock into an operational signal. The recurring finding across published postmortems is that runaway LLM spend is rarely caused by growth; it is caused by a change nobody connected to cost, and per-request telemetry makes the connection same-day.
Layer three is the reason the discipline exists. Quality signals come from three sources, and mature teams run all three: automated evaluation on a sample of live traffic, typically with a model grading outputs against task-specific criteria; implicit user signals such as edit rates, retry rates, abandonment, and thumbs-down clicks; and guardrail telemetry, since every input the safety layer blocks or output it rewrites is also a data point about what production is seeing. The runtime enforcement side of that layer is its own design problem, covered in the guide to LLM guardrails in production; observability's job is to make sure what guardrails see is recorded and trended rather than just enforced and forgotten.
Layer four is what makes debugging possible at all. The moment a feature is a chain rather than a single call, a retrieval step feeding a generation feeding a tool call, request-level logs stop being useful: the final output was shaped by five intermediate artifacts nobody stored. Trace-level instrumentation records the full tree of each run, which is what allows a team to answer "why did it say that" for one user and "which step is eating the latency budget" for all of them. This is also where the emerging standard sits: the OpenTelemetry project has been developing generative-AI semantic conventions so that LLM traces carry consistent attributes across tools, and instrumenting to that convention is the least lock-in path available. Where this layer sits relative to the gateway, evaluation, and guardrail layers of the broader platform is mapped in the enterprise AI stack reference architecture.
What to Alert On Versus What to Review Weekly
The most common operational mistake is applying the alerting reflex to every new signal. Quality metrics move slowly, carry sampling noise, and demand judgment; paging on them trains the on-call to ignore pages. The correct split follows the speed of the signal, not its importance.
Page or alert on fast, unambiguous signals: provider error and timeout spikes, latency beyond SLO, refusal-rate spikes (which often indicate a provider-side model or safety change), cost per request beyond a threshold, guardrail hard-block spikes, and format-validity collapses that break downstream parsing. Each of these is objectively measurable, actionable within the hour, and expensive per hour of delay.
Review weekly, with humans, the slow signals that decide whether the product is getting better: evaluation score trends per feature, user feedback and edit-rate trends, input drift (are customers asking things the prompt was never designed for), cost per feature trends, and a hand-read sample of traces including the worst-scored ones. The weekly trace-reading habit is the single practice that most reliably separates teams that catch regressions from teams that read about them in support tickets, and no vendor can sell it.
The failure mode to design against is the silent middle: a signal too slow to page on and too diffuse for anyone to own, which is how a quality score erodes eight percent over a quarter without a single alert firing. The fix is ownership, not thresholds: every LLM feature has a named owner who reads its dashboard weekly, the same way a P&L line has an owner.
Build Versus Buy, Honestly
The vendor landscape spans open-source tracing platforms, LLM-specialist observability products, and the LLM modules that incumbent APM suites have added. The capabilities have converged substantially: trace capture, prompt-version tracking, cost dashboards, and eval integration are baseline across all three groups, so the decision is less about features than about position.
The structural arguments: an organization already paying a large APM bill gains consolidation and loses depth by using its incumbent's LLM module; specialist products are deeper on evaluation workflows but add another vendor and another data pipeline; open-source platforms trade licence cost for operational ownership and are the natural fit where traces contain data that cannot leave the network. Two considerations outrank the feature grid. First, data gravity: LLM traces contain prompts and outputs, which is to say customer data, and where they are stored is a compliance decision before it is a tooling decision. Second, exit cost: instrumenting against the OpenTelemetry generative-AI conventions rather than a vendor SDK keeps the telemetry portable when the landscape shifts, and this market is young enough that it will.
What should not be bought is the part vendors cannot supply: the definition of "good output" for each specific task, the evaluation datasets that encode it, and the weekly attention of someone accountable. Teams that buy a platform expecting it to answer "is quality okay" discover it can only answer "here is what happened"; the judgment layer is always built in-house.
| Team maturity | Right-sized observability investment |
|---|---|
| Prototype or pilot, no external users | Log requests and responses with prompt/model versions; track spend manually; no platform needed yet |
| First feature in production, single-step calls | Adopt a tracing platform (open-source or vendor); layer-two cost telemetry per feature; basic alerts on errors, latency, cost |
| Multiple features or chained/agentic workflows | Full four layers; sampled automated evaluation on live traffic; weekly quality review with a named owner per feature |
| LLM features are core product at scale | Dedicated eval and observability ownership; regression suite fed from production; drift detection; cost and quality SLOs in executive reporting |
Closing the Loop: Observability Feeds Evaluation
The practices above describe watching production. The compounding value comes from feeding it back. Every confirmed production failure, a wrong answer, a formatting break, a jailbreak that slipped through, a trace a reviewer flagged in the weekly read, should be captured with its full trace and added to the evaluation suite as a regression case. From then on, every prompt change, model upgrade, and configuration change is tested against it before shipping.
This loop changes the economics of quality. Without it, each regression is an incident to be diagnosed from scratch, and the same class of failure recurs with each model upgrade. With it, the evaluation suite grows monotonically more representative of real traffic, and the cost of trying a new model or prompt drops, because the question "did anything break" has a mechanical answer. Teams running this loop describe an inversion of posture: model upgrades stop being feared events and become routine experiments, since the harness catches what the upgrade breaks before customers do. That inversion, more than any dashboard, is the return on investment of observability, and it is only available to teams that treat production traces as evaluation data rather than exhaust.
The practical mechanics are modest: a triage tag in the tracing tool, a weekly export of flagged traces, a review step that converts them into labeled eval cases. The barrier is organizational, deciding that the eval suite is a living asset with an owner, not a launch artifact. Organizations that clear that barrier get the flywheel; organizations that do not get a very detailed record of their unrepeated mistakes.
FAQ
What is LLM observability?
LLM observability is the practice of instrumenting AI systems in production so that quality, cost, and behavior are measurable, not just uptime and errors. It adds three layers to classic monitoring: token and cost telemetry per request, quality signals from automated evaluation and user feedback, and trace-level records of multi-step chains and agent runs, all tagged with prompt and model versions so any output can be explained and any regression can be dated.
How is LLM monitoring different from traditional APM?
Traditional APM detects failures that announce themselves: errors, latency, saturation. An LLM feature can be healthy on every one of those signals while producing worse answers than last week, because model outputs are non-deterministic, correctness is not checkable at request time, and behavior shifts with prompt edits, model updates, and input drift rather than code deploys. LLM monitoring therefore tracks output distributions, sampled quality scores, and per-request cost alongside classic health metrics.
What LLM metrics should trigger alerts?
Alert on fast, unambiguous, expensive signals: provider error and timeout spikes, latency beyond target, sudden refusal-rate increases, cost per request above threshold, guardrail hard-block spikes, and output-format failures that break downstream systems. Quality scores, feedback trends, and input drift move too slowly and noisily for paging; they belong in a weekly human review, not an alert channel.
Should a team build or buy LLM observability tooling?
Adopt the platform layer, open-source or commercial, rather than building trace storage and dashboards in-house; the capabilities have commoditized. Decide based on where trace data is allowed to live and on portability, favoring tools aligned with OpenTelemetry's generative-AI conventions. What cannot be bought is task-specific quality definitions, evaluation datasets, and a named owner who reviews the signals weekly; that judgment layer is always built internally.
How does observability connect to LLM evaluation?
Observability watches live traffic; evaluation tests changes before they ship. The connection is the regression loop: production failures captured in traces become labeled cases in the evaluation suite, so every future prompt or model change is tested against them. This loop is the main compounding return of observability, because it converts each incident into permanent protection instead of a one-time diagnosis.
Related reading on FinTekCafe
Related Articles
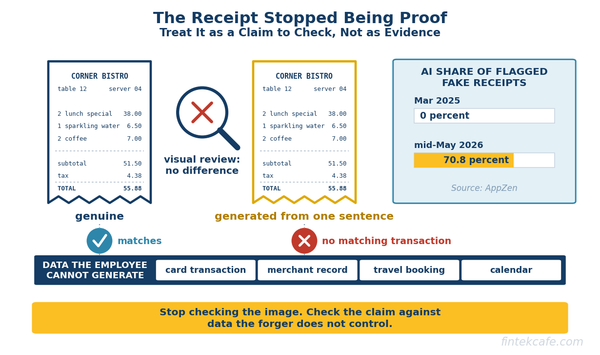
AI-Generated Fake Receipts: How Expense Fraud Changed and How Finance Teams Catch It
AI-generated fake receipts now beat visual review. How expense fraud changed, which detection still works, and the controls to use by company size.
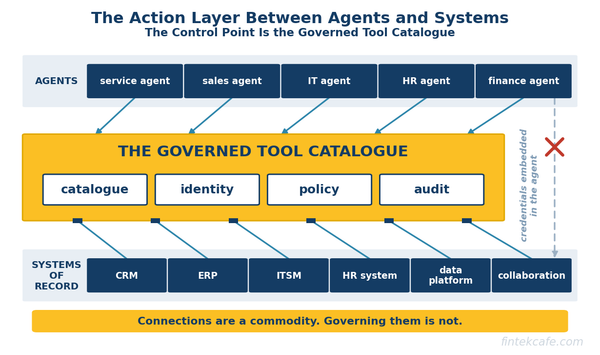
Integration Platforms Are the Quiet Winners of the Agent Era
Agents act through integrations. iPaaS and API vendors hold the connectors, credentials and audit trails, and MCP makes governing that layer worth more.
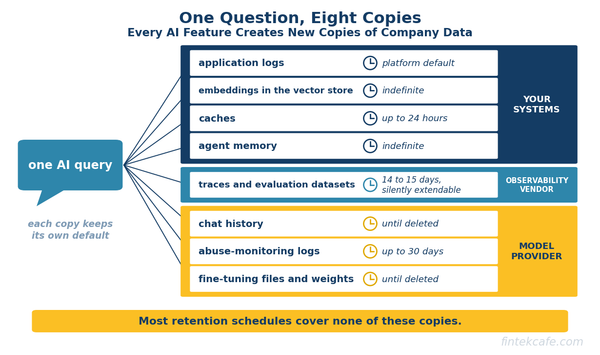
What Happens to Your Data Inside AI Systems: Retention, Deletion and the Copies Nobody Tracks
Every AI feature copies company data into prompts, logs, embeddings and memory. Where each copy lives, what vendors retain, and how to make deletion real.