
Service Level Objectives: Setting Reliability Targets That Survive Contact With the Business
Most reliability programs die at the same point: the organization picks a number of nines by intuition, discovers that nobody will trade a feature for it, and quietly stops looking at the dashboard. The failure is not technical. It is that a reliability target without a spending mechanism is a statement of preference, and statements of preference lose every argument against a dated commercial commitment. The teams that make this work do one thing differently. They convert reliability into a budget that can be spent, attach a written policy to what happens when it runs out, and get that policy agreed before it is needed rather than during the incident review that follows it being exceeded. This piece covers the three terms that get conflated, how to choose indicators users can actually perceive, why the error budget policy is the only component that changes behavior, the cost arithmetic executives should see once, and the order to roll this out in.
Key Takeaways
- Three distinct things. The SLI is the measurement, the SLO is the internal target, and the SLA is the external contract with financial consequences. Conflating them is why engineering and sales argue past each other about the same number.
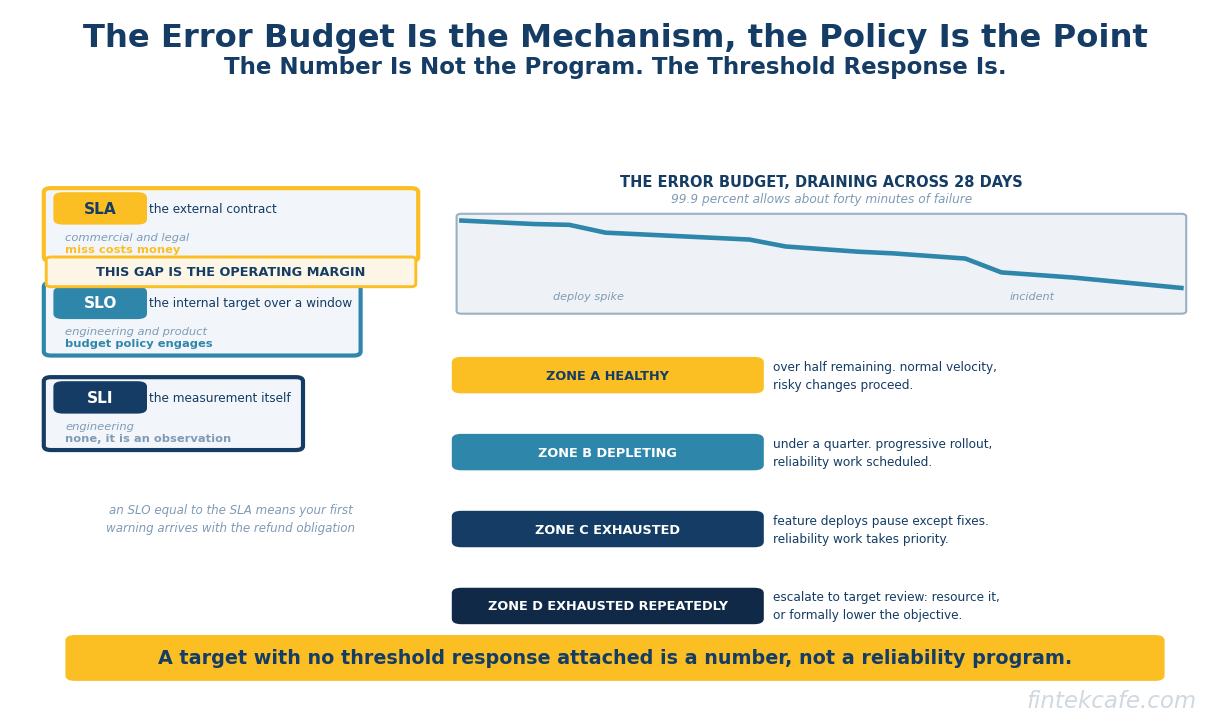
- The SLO should sit meaningfully tighter than any SLA. The gap is the operating margin, because breaching an internal target is a signal and breaching a contract is a refund.
- Measure the user journey, not the host. Request success rate on critical user journeys beats host availability, and a latency target at a percentile matched to the interaction beats an average that hides the experience of the slowest users.
- The error budget is the mechanism, and the policy is the point. An error budget with no written consequence when exhausted is a dashboard. The policy converts reliability from an opinion into a decision rule agreed in advance.
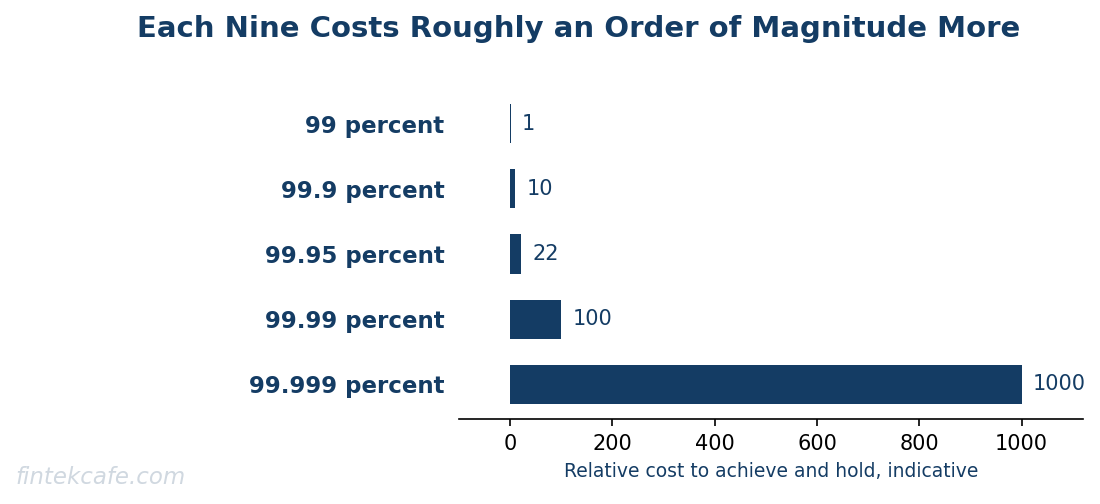
- The cost curve is not linear. Each additional nine costs roughly an order of magnitude more, and past a point the marginal customer cannot perceive the difference while the dependencies the service runs on cannot support the claim anyway.
Three Terms, Three Audiences
A service level indicator is a measurement, a service level objective is the internal target for that measurement, and a service level agreement is a contractual promise carrying financial consequences. They are frequently used interchangeably in meetings, and the resulting confusion is not cosmetic.
| Term | What it is | Who owns it | Consequence of a miss |
|---|---|---|---|
| SLI | A carefully defined metric, such as the proportion of requests on a journey that succeed within a latency threshold | Engineering | None; it is an observation |
| SLO | The internal target for that SLI over a defined window, for example 99.9 percent over 28 days | Engineering and product jointly | Error budget policy engages; work reprioritizes |
| SLA | The external commitment, usually looser than the SLO, with service credits attached | Commercial, legal, and finance | Money, and occasionally termination rights |
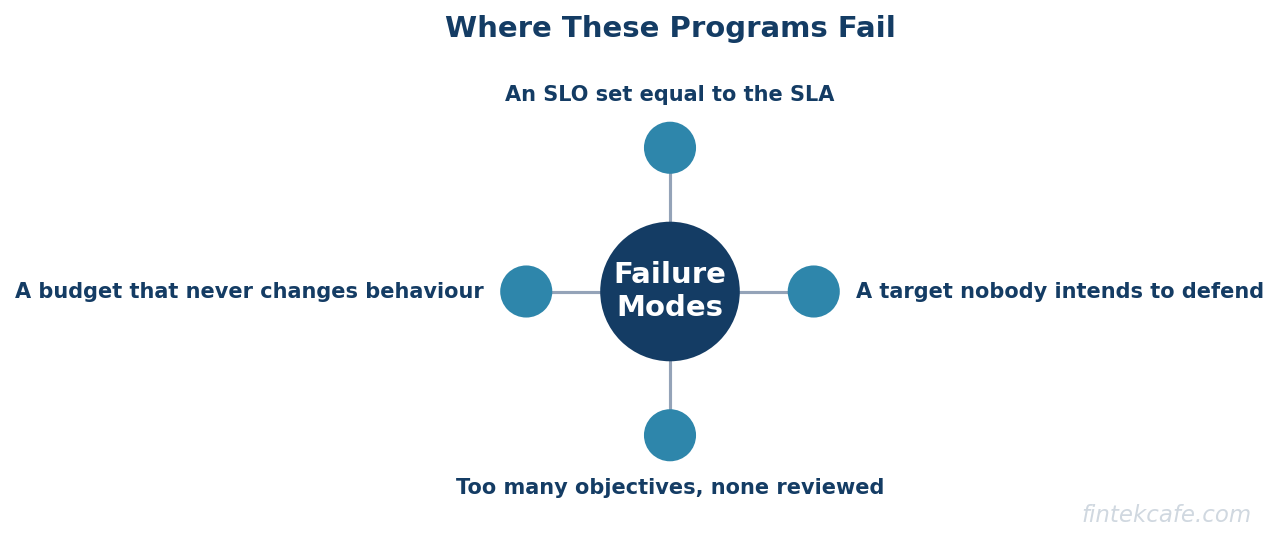
The ordering matters. The SLA is negotiated with customers, the SLO is set tighter than the SLA so that internal alarms fire before contractual exposure begins, and the SLI is the measurement both depend on. An organization whose SLO equals its SLA has no warning margin at all: the first signal that something is wrong arrives at the same moment the refund obligation does.
The gap should be deliberate. If the contract promises 99.5 percent, an internal objective of 99.9 percent means the team is working to a standard that leaves room to detect and correct before a customer has a claim. Setting the internal target looser than the contract, which happens more often than it should when the two are set by different groups who never compare notes, means the service can be operating exactly to plan and still be in breach.
Choosing an Indicator the User Can Perceive
The most common technical error in an SLO program is measuring something operationally convenient rather than something the user experiences.
Host availability is the classic example. A fleet can be ninety-nine point nine percent available while a dependency failure makes every request return an error, and the dashboard stays green throughout. Users are experiencing a total outage that the indicator cannot see, because the indicator was measuring whether machines respond rather than whether work completes.
| Journey type | Good SLI | Weak SLI | Why the weak one fails |
|---|---|---|---|
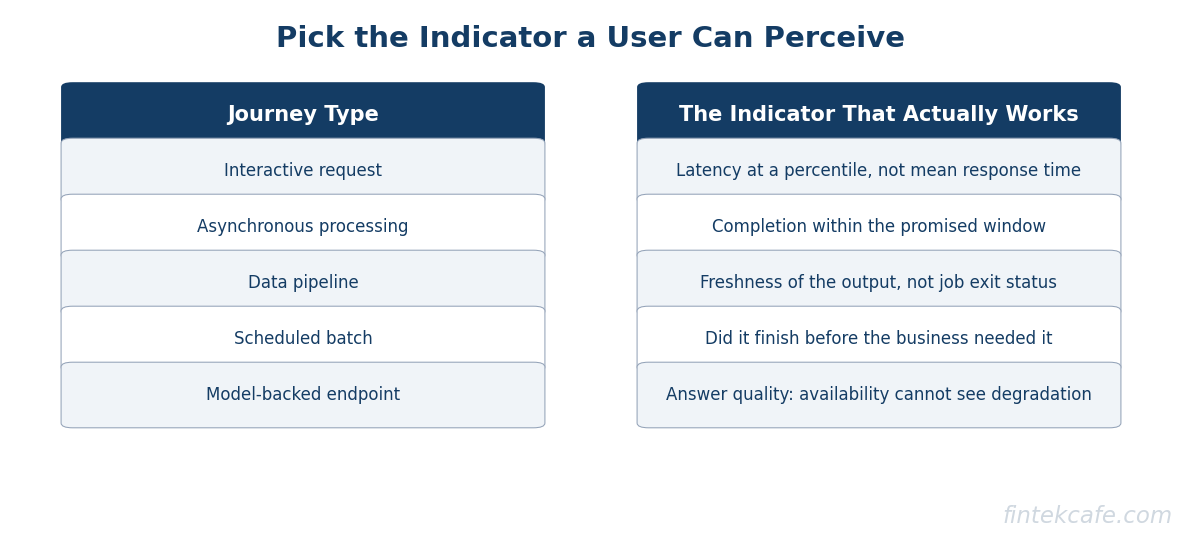
| Interactive API or page load | Proportion of requests returning success within a latency threshold | Host uptime, average response time | Averages conceal the tail; uptime ignores whether the response was correct or usable |
| Asynchronous processing | Proportion of jobs completing within a target time from submission | Queue depth, worker uptime | Queue depth is a leading signal for operators, not an experience for the user |
| Data pipeline or reporting | Freshness, meaning the proportion of time the data is no older than a stated bound, plus completeness | Pipeline run success | A run can succeed and still produce stale or partial output |
| Scheduled or batch work | Proportion of runs completing before the business deadline | Job exit code | Exit zero at three hours past the deadline is a failure the code cannot express |
| Model-backed endpoint | Success within latency, plus a separate quality indicator against a fixed evaluation set | Endpoint availability | The endpoint answers every request and the answers degrade; availability cannot see it |
Three selection rules make this tractable.
Start from critical user journeys. Enumerate the handful of things users do that matter most, such as sign in, search, add to cart, pay, receive a report. Define indicators on those. A service with twenty endpoints does not need twenty objectives; it needs objectives on the three journeys whose failure generates calls.
Match the percentile to the interaction. For a page load, the ninety-fifth or ninety-ninth percentile is what determines perception, because the slowest requests are where abandonment occurs. For a long-running batch job, a median is closer to meaningful. Setting every latency objective at the ninety-ninth percentile out of rigor creates targets driven by outliers nobody experiences as a problem.
Measure as close to the user as is practical. Server-side measurement misses failures that never reach the server, including client errors, DNS problems, and network failures at the edge. Client-side or synthetic measurement from outside the perimeter is noisier and more honest.
Journey-level indicators carry a cost that host metrics do not, because labelling requests by journey, endpoint, and outcome multiplies the number of distinct time series being stored, and high cardinality is the primary driver of observability platform spend. This is an argument for defining objectives on a handful of journeys rather than instrumenting exhaustively, not an argument for measuring the easier thing.
The Error Budget Is the Whole Mechanism
An error budget is the amount of unreliability an objective permits over its window, and its value is that it is spendable. An objective of 99.9 percent over 28 days allows approximately forty minutes of failure. That is not an aspiration. It is an allowance.
This reframing does the work that a percentage alone cannot. Reliability arguments are usually unwinnable because they are conducted in the language of virtue, where nobody can argue for less reliability without appearing reckless. A budget converts the discussion into an allocation question that people already know how to conduct. There is a quantity, it is finite, spending it on one thing means not spending it on another, and a risky deployment becomes a purchase rather than a moral position.
Three practices make it operational.
Burn rate alerting instead of threshold alerting. Alert on the rate at which the budget is being consumed rather than on an instantaneous error rate. A fast burn, where a substantial share of the window's budget is consumed in an hour, warrants waking someone. A slow burn that will exhaust the budget over several days warrants a ticket. This distinction reduces pager load more than almost any other change, and it is the pattern that makes the difference between a team that trusts its alerts and one that has learned to ignore them.
Count planned maintenance against the budget. Users do not experience a maintenance window differently from an outage. Excluding planned downtime produces a number that flatters the team and misrepresents the experience.
Let the budget accumulate visibly, and let it be spent deliberately. A team sitting on an unspent budget at the end of a window is running more conservatively than the organization asked for, which is itself information: either the target is too loose or the team is over-investing in reliability relative to the agreed standard.
The policy is the part everyone skips
An error budget with no written policy attached is a chart. The policy states what happens at defined thresholds, and it is agreed by engineering and product together, in advance, while nobody is under pressure.
| Budget state | Standard policy response | What it prevents |
|---|---|---|
| Healthy, more than half remaining | Normal velocity; risky changes and experiments proceed | Excess caution that wastes the reliability being paid for |
| Depleting, under a quarter remaining | Elevated change scrutiny; deploys ship behind progressive rollout; reliability work is scheduled | Discovering the problem at zero |
| Exhausted | Feature deploys pause except for fixes; reliability work takes priority until the budget recovers | The indefinite deferral of reliability work in favor of the roadmap |
| Exhausted repeatedly across windows | Escalation to a target review: either resource the reliability work or formally lower the objective | A target nobody intends to defend persisting as theatre |
The last row is the one that keeps the program honest. If an objective is missed for three consecutive windows and nothing changes, the objective is fictional, and the correct response is either investment or an explicit, documented decision to accept a lower standard. Both are defensible. Continuing to publish a target the organization has no intention of meeting is not, and it corrodes the credibility of every other number the team reports.
A freeze that can be overridden by anyone senior enough is not a policy. The override path should exist, because commercial reality sometimes genuinely outweighs the rule, and it should require a named person to accept the decision in writing. Making the exception visible is what preserves the mechanism.
The Arithmetic Executives Should See Once
Each additional nine reduces permitted downtime by a factor of ten and raises cost by roughly an order of magnitude.
| Objective | Downtime permitted per 30 days | What it typically requires |
|---|---|---|
| 99 percent | About 7 hours | Competent single-region operation and business-hours response |
| 99.9 percent | About 43 minutes | Redundancy within a region, automated failover, and a real on-call rotation |
| 99.95 percent | About 22 minutes | Multi-zone deployment, tested failover, and mature change management |
| 99.99 percent | About 4 minutes | Multi-region active configuration, no single points of failure, and automated remediation, since humans cannot respond inside the window |
| 99.999 percent | About 26 seconds | Specialized architecture at a cost most businesses cannot justify outside specific domains |
Two points make this useful in a planning conversation.
The first is the dependency ceiling. A service cannot exceed the reliability of what it depends on. Building toward 99.99 percent on top of a component whose own commitment is 99.9 percent means the target is unreachable regardless of local effort, and the honest answer is to change the architecture, change the dependency, or change the target.
The second is perception. Past a point, users cannot distinguish improvements. A consumer application moving from 99.9 to 99.99 percent is spending significantly for a difference most customers will never notice, particularly when their own network connection is less reliable than either figure. That spend may still be correct where a contract demands it or where a single outage carries regulatory consequence, and it should be a deliberate decision rather than an engineering reflex toward more nines.
Objectives also do not have to be uniform. Payment processing may warrant 99.99 percent while the recommendations panel warrants 99.5, and differentiating them puts the investment where failure actually costs something. The counterpart question, how long recovery takes when something does fail badly, belongs to disaster recovery planning rather than to steady-state objectives, and the two are frequently confused in the same conversation.
Where These Programs Fail
Too many objectives. Every service gets one, dozens exist, nobody reviews them, and the program becomes a compliance exercise. A handful of objectives on genuinely critical journeys beats comprehensive coverage nobody reads.
Objectives on things users cannot perceive. CPU utilization, queue depth, and cache hit rate are operational signals. They belong on dashboards and should not be objectives, because no policy response follows from missing them.
Aspirational targets. An objective set at 99.99 percent because it sounds appropriately serious, with no intention of funding multi-region architecture, will be missed continuously until everyone stops looking. Set the target at what the service currently achieves plus a deliberate improvement, then tighten it.
No policy attached. Covered above, and worth repeating because it is the single most common failure. The dashboard is not the mechanism.
Measuring what is easy to instrument. The reason host uptime is so often the indicator is that it requires no work. The instrumentation cost of a journey-level indicator is real, which is the argument for collecting it through a pipeline that can shape and route telemetry rather than paying full price to store everything, a shift covered in the unbundling of observability.
Two Wrinkles Worth Planning For
On-call load is a reliability outcome. A team paged repeatedly for symptoms with no policy response degrades, and a degraded team causes incidents. Burn-rate alerting is partly a humane control: it separates the events that need a person now from the ones that need a ticket. A useful secondary indicator for any reliability program is pages per on-call shift, trending down.
Model-backed endpoints break the binary indicator. An endpoint serving a language model returns a successful response to nearly every request while the usefulness of those responses varies with model version, prompt changes, retrieval quality, and provider-side updates the organization does not control. Availability stays at effectively one hundred percent through a quality regression that users notice immediately.
The workable pattern is a paired objective: a conventional success-within-latency indicator, plus a quality indicator scored against a fixed evaluation set run on a schedule, with its own target and its own budget. Latency distributions for these endpoints are also wider and more variable than for conventional services, which makes percentile selection matter more and makes averages actively misleading. Changes to these systems should ride the same progressive rollout machinery used for any risky change, since the techniques in progressive delivery and feature flags are what make a quality regression a partial exposure rather than a full one.
A Rollout Order
One service, one journey, one indicator. Pick the service where failure is most visible and instrument the single most important journey. Resist starting with a taxonomy.
Measure for a full window before setting a target. Four weeks of data reveals actual performance, which is almost always different from what people assume. Setting targets before measuring produces the aspirational numbers described above.
Set the objective at current performance, then tighten deliberately. A target the service already meets is not a failure of ambition. It establishes the baseline and the mechanism, and tightening it is a decision with a cost that can now be discussed concretely.
Write the policy and get it agreed. Before the budget is ever exhausted. This is the step that determines whether the program survives its first conflict with a launch date.
Expand only after the first policy engagement works. The proof that the program is real is a deploy that was genuinely paused, or a target that was genuinely lowered on the record. Until one of those has happened, expanding coverage is adding dashboards.
Frequently Asked Questions
What is the difference between an SLI, an SLO, and an SLA?
The SLI is the measurement, such as the proportion of checkout requests that succeed within two seconds. The SLO is the internal target for that measurement over a window, such as 99.9 percent over 28 days. The SLA is the external contractual commitment, usually looser, with service credits or other financial consequences attached. The internal objective should sit meaningfully tighter than the contractual commitment so that internal alarms fire before customer exposure begins.
How do I choose the right SLO target?
Measure current performance for at least one full window first, then set the objective at or slightly above what the service actually achieves, and tighten it deliberately over time. Targets chosen before measurement are almost always aspirational and get abandoned. Also check the dependency ceiling: a service cannot be more reliable than the components it depends on, so a target above a dependency's own commitment is unreachable no matter how much local effort is applied.
What is an error budget and how does it work?
An error budget is the unreliability an objective permits over its window. A target of 99.9 percent over 28 days allows roughly forty minutes of failure, and that allowance is spendable on risky deploys, migrations, and experiments. Its value is converting reliability from a virtue argument, which nobody can win, into an allocation decision organizations already know how to make. The budget only functions when a written policy states what happens as it depletes and when it is exhausted.
Why do most SLO programs fail?
Because no policy is attached to the error budget. A budget that depletes with no agreed consequence is a chart, and reliability work continues to lose to roadmap work exactly as it did before. The secondary causes are having too many objectives for anyone to review, defining objectives on operational metrics users cannot perceive, and setting aspirational targets the organization never intends to fund.
How do SLOs work for AI and model-backed services?
A conventional success-within-latency indicator remains necessary and is no longer sufficient, because these endpoints answer nearly every request successfully while answer quality drifts with model versions, prompt changes, and retrieval quality. The workable pattern pairs the availability indicator with a quality indicator scored against a fixed evaluation set on a schedule, each carrying its own target and budget. Latency percentile choice also matters more, since these distributions are wider and averages hide the experience users actually have.
The Bottom Line
The question that reveals whether a reliability program is real is not what the targets are. It is what happened the last time one was missed. In most organizations the answer is that a chart turned red, somebody mentioned it in a review, and the roadmap continued unchanged, which means the target was never a target.
The mechanism that fixes this is unglamorous and cheap. Define a small number of indicators on journeys users actually perform, measure before committing to a number, express the target as a budget that can be spent, and write down in advance what happens when it runs out, including who can override and how that override gets recorded. The technical work of instrumentation is the easy half. The half that determines whether any of it matters is getting a product leader to agree, in writing and before the argument, that there is a point at which shipping stops.
Related Articles
Integration Platforms Are the Quiet Winners of the Agent Era
Agents act through integrations. iPaaS and API vendors hold the connectors, credentials and audit trails, and MCP makes governing that layer worth more.
What Happens to Your Data Inside AI Systems: Retention, Deletion and the Copies Nobody Tracks
Every AI feature copies company data into prompts, logs, embeddings and memory. Where each copy lives, what vendors retain, and how to make deletion real.
Data Classification: The Step Every Enterprise AI Rollout Skips, and What It Costs Later
Why AI assistants expose overshared data, how data classification fixes it, what to label first, and a 90-day plan for executives.