
Agent Observability: How to Trace, Evaluate, and Debug AI Agents in Production
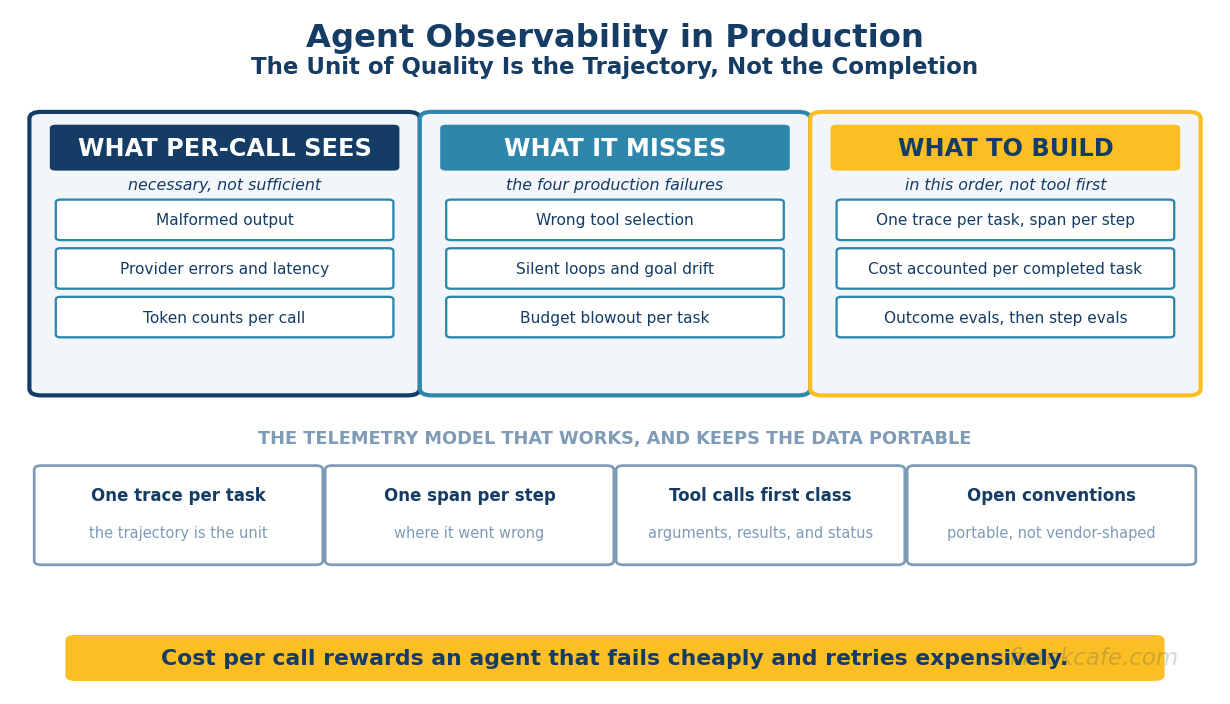
Agent observability is the practice of instrumenting an agent so that the whole multi-step task, not the individual model call, is the unit you can inspect, evaluate, and alert on. Classic LLM observability was built around a single request and response: log the prompt, log the completion, score the output, watch tokens and latency. That collapses for agents, because an agent answers a task by taking a sequence of steps, and the failures that cost money are properties of the sequence rather than any step in it. An agent that picks the wrong tool, loops silently until its step budget is gone, drifts from the goal it was given, or burns forty model calls on a task that needed three emits a clean log line at every call. Each one looks fine; the trajectory is broken.
For agents the unit of quality is the trajectory and the unit of most existing telemetry is the call. Everything below closes that gap, in the order a platform team should close it.
Key Takeaways
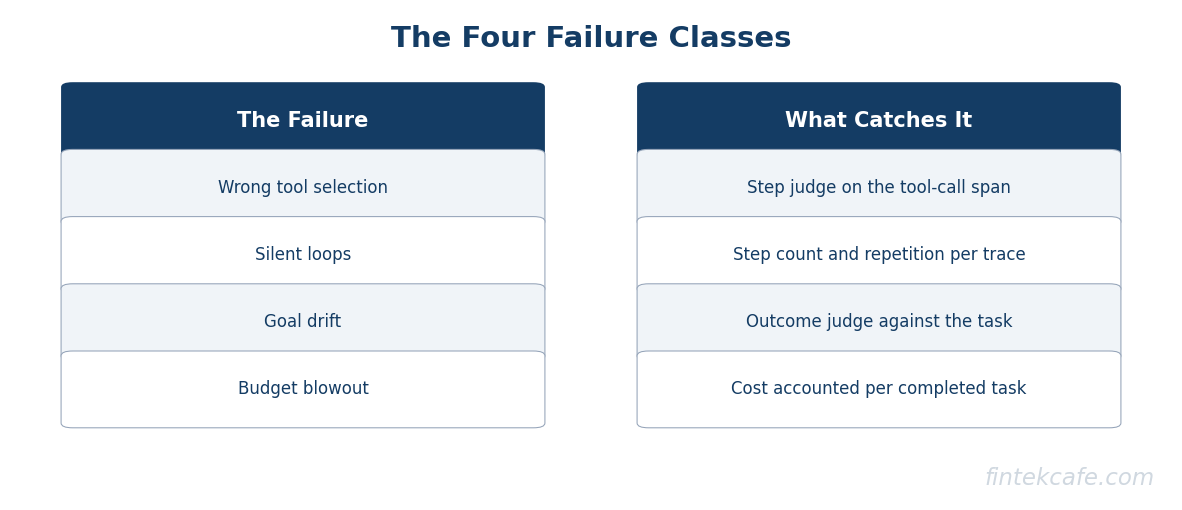
- The unit of quality for an agent is the trajectory, not the completion. Per-call logging catches malformed output and provider errors and is blind to wrong tool selection, silent loops, goal drift, and budget blowout, the four failures that dominate production incidents.
- The telemetry model that works is one trace per task, one span per step, tool calls as first-class spans carrying arguments, results, and status. OpenTelemetry's GenAI conventions are the emerging attribute standard, and adopting them keeps the data portable.
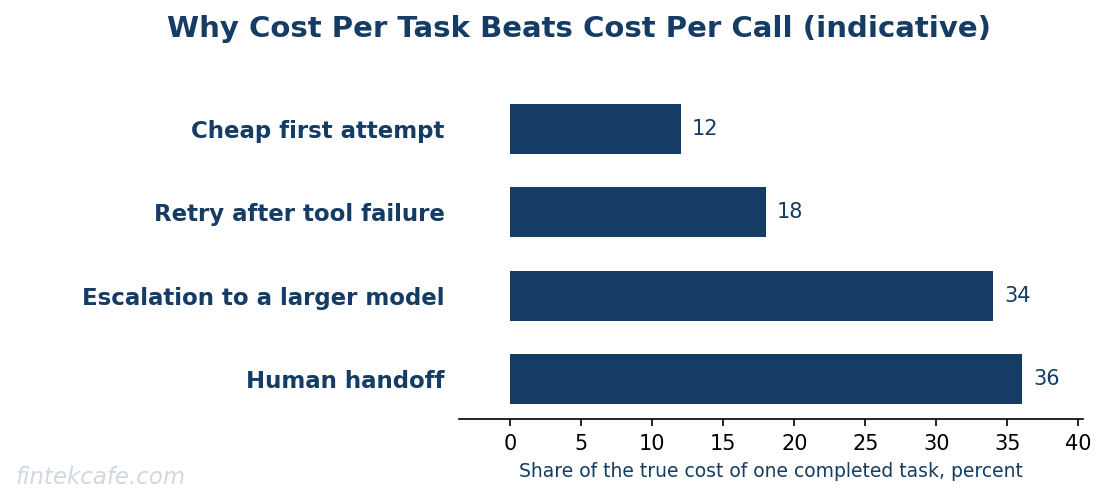
- Account cost and latency per completed task, not per call. Cost per call rewards an agent that fails cheaply and retries expensively, and hides the retry, the escalation, and the human handoff the task actually consumed.
- Evaluation needs both altitudes: outcome judges say whether the task succeeded, step judges say where it went wrong. A golden suite plus replay of real production trajectories turns agent changes from guesses into measurements.
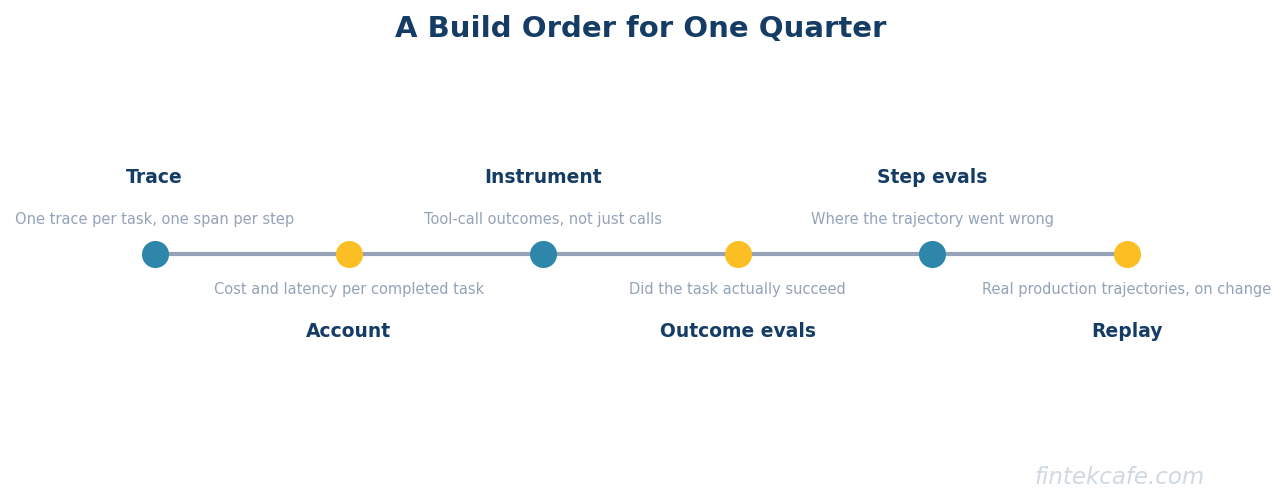
- Build order beats tool choice: trace the trajectory, account cost per task, instrument tool-call outcomes, add outcome evals, add step evals, then close the loop with replay. Teams that start at evaluation score outputs they cannot explain.
Why Single-Call Observability Collapses
If a request goes to a model and comes back, then prompt text, completion text, token counts, latency, and error rate are close to a complete picture, and the practices for that layer are covered in the guide to LLM observability and monitoring. Nothing there is wrong. It is the wrong altitude for an agent.
Consider a support agent resolving a refund: read the ticket, query the order system, check the policy, decide eligibility, call the payment tool, confirm. Four ways that fails. It queries the wrong system, gets an empty result that is technically valid, and concludes the order does not exist. It re-reads and rephrases the policy until the step budget is gone. It hits an ambiguity and quietly redefines the task as answering a general policy question. Or it succeeds using thirty eight model calls because a retry loop around a flaky tool fired repeatedly.
Every call succeeded in all four: token counts normal, latency normal, error rate zero. The dashboards are green and the product is broken. This is the structural gap that makes agent frameworks fail in ways their component tests never predict, examined in the analysis of agent framework production failure modes: the loop's behavior is not visible in its parts.
The Telemetry Model
The data model that resolves this is not novel. It is distributed tracing, applied honestly to an agent.
A trace is one task. What gets a trace identifier is what a user or upstream system asked for, from arrival to final answer or giving up. Not one model call, and not one conversation turn if a turn can trigger multiple steps. If your traces are per call, you have logs with extra steps.
A span is one step. Every model invocation, tool call, retrieval, guardrail check, and sub-agent delegation is a span nested under the task trace. The nesting carries the information: a span tree shows the policy lookup ran three times, the payment tool was never reached, a sub-agent returned something the parent ignored.
Tool calls are first-class spans, not attributes on a model span. This is the most common instrumentation mistake. Buried as a JSON blob inside a model span's output, the tool becomes unqueryable: you cannot ask which tool fails most, which arguments correlate with task failure, or how long the agent waits on external systems. A tool-call span should carry the tool name, arguments, a result summary or hash, status, latency, and whether the result was used next.
Attribute names should follow the OpenTelemetry GenAI semantic conventions, which cover operation names, model identifiers, token usage, and tool-call attributes. They are evolving rather than frozen, a reason to track them rather than wait: their value is that instrumentation, dashboards, and eval harnesses stop being coupled to one vendor's schema. An organization that instruments to a vendor-specific format has made its observability data as portable as its least portable component.
Four attributes get omitted and regretted: a step index and budget per span, so exhaustion is queryable rather than inferred; a goal field captured at trace start, so drift can be measured against something; a cost field on every span, computed at ingestion, so cost aggregates up the tree without a join; and a termination reason (succeeded, gave up, budget exhausted, guardrail halted, error, timed out). That last field converts a large class of silent failures into a chart.
The Four Failure Classes
Agent failures cluster into four classes. Each has a cheap leading signal once the trajectory is traced, and each has a different correct response, which is why one "agent quality" metric is a mistake.
Wrong tool selection is an inappropriate tool, or the right tool with wrong arguments; it worsens as the tool count grows, because tool descriptions compete for the model's attention. Silent loops are repeated near-identical steps that make no progress: the agent is not erroring, it is retrying and rephrasing, which is invisible without trajectory tracing and highly visible on the bill. Goal drift is the agent ending up somewhere other than where it was pointed, usually after an ambiguity or partial failure, and it is the most damaging when it reaches a user because the output is coherent and confidently wrong about what was asked. Budget blowout is completion at unacceptable cost or latency, the easiest to detect and the most under-instrumented, because per-call dashboards hide it.
| Failure class | Leading signal | Starting alert threshold | Correct response |
|---|---|---|---|
| Wrong tool selection | Tool-call result never referenced in the next step; per-tool empty-result and error rate | Unreferenced-result rate above roughly five percent for any tool | Fix tool descriptions and schemas; split overloaded tools; narrow the tools per task |
| Silent loop | Same tool called with similar arguments more than twice; step count above the type's ninety fifth percentile | Any trace above twice the median step count for its type | Hard step budget with a termination reason; loop detection that halts rather than warns |
| Goal drift | Judge score comparing final output and late steps against captured task intent | Drift-flag rate above the golden-suite baseline | Tighten the task contract; re-anchor the goal each step; escalate on low confidence |
| Budget blowout | Cost and step count per completed task as a distribution; tail share of spend | Task types whose ninety fifth percentile cost exceeds a few times the median | Cap budget per task; route routine subtasks to cheaper models; cache tool results |
Those thresholds are starting points, replaced by your own baselines within two weeks of having data. Publishing a threshold you have not measured is how alerting gets ignored.
Trajectory Evaluation
Once trajectories are traced they can be evaluated, and evaluation is where the durable value sits. Agent evaluation is a measurement program rather than a test suite, a distinction developed in the executive guide to AI evals.
Outcome-Level Versus Step-Level Judges
An outcome-level judge asks whether the task was accomplished. It is the metric that matters, the one to put in front of a stakeholder, and cheap because it runs once per trace. It is also nearly useless for debugging: a failed outcome says nothing about which of eleven steps went wrong. A step-level judge evaluates individual decisions (right tool, reasonable arguments, did this step advance the task), which makes an agent debuggable and is expensive, because a judge call per span multiplies cost by trajectory length.
The working pattern is asymmetric sampling: outcome judges on a high fraction of production traffic, step judges on a low sample plus every trace that failed its outcome judge or tripped a failure-class signal. That puts expensive evaluation where the information is instead of scoring everything equally.
| Evaluation layer | What it answers | Cost | Run it on |
|---|---|---|---|
| Deterministic checks (schema, tool success, budget) | Did the mechanics hold | Free | Every trace: alerting and hard gating |
| Outcome judge | Did the task succeed | One call per trace | High production sample, all of the golden suite |
| Step judge | Where did it go wrong | One call per span | Failures, flagged traces, small random sample |
| Human review | Is the judge itself right | Expensive, slow | Small stratified sample, all disputed cases |
The last row is the one teams skip, and skipping it produces an evaluation system nobody trusts. A judge never checked against human labels is an unvalidated instrument, and its agreement rate is a number the platform team should be able to state on demand.
Golden Task Suites
A golden suite for agents is not prompts with expected strings. It is tasks with a defined initial state, tools in a controlled configuration, and a definition of success at the outcome level. The tool decision costs something either way: live tools give realism and non-determinism, which makes regressions hard to attribute, while mocks give determinism and drift. Most teams converge on a mocked suite gating continuous integration plus a smaller live-tool suite on a schedule to catch the drift the mocks hide.
Weight coverage toward the failure classes above, not the happy path: the tasks that earn their place are the ambiguous request, the tool that returns empty, the tool that errors, and the one where two tools plausibly apply.
Replaying Production Trajectories
The technique that most distinguishes a mature agent platform is replay: run real production trajectories against a candidate change (a new prompt, model, tool description, or routing rule) and compare outcomes trajectory by trajectory.
Replay solves the sample problem: a golden suite has the coverage its authors imagined, production has the coverage reality provides. Replaying a few thousand real trajectories answers the only question that matters at deploy time: does this change make things better or worse, and for whom.
Three requirements gate it, and each is a reason teams cannot replay yet. Capture must be complete enough to reconstruct the run, including tool inputs and outputs, not just model messages. Tool calls must be replayable: recorded results for reads, hard blocking for writes, because replaying a refund is not a test, it is a refund. And comparison must be automated, because a human diffing two thousand trajectory pairs is not a process. This is also where routing decisions get validated rather than assumed, which connects to the tier-selection question in the guide to LLM model routing in production.
Cost and Latency Accounting Per Task
The accounting change is small and the behavioral change large: make the denominator a completed task.
Cost per call is actively misleading for agents. It falls when an agent takes more, cheaper steps, and again when an agent fails early and the retry counts as a separate task. It says nothing about escalation to a frontier model, the human handoff, or the second attempt by an annoyed user. A team optimizing cost per call can make every dashboard number improve while the cost of resolving a request rises.
Cost per completed task needs three refinements to be honest. Include failed attempts, attributed to the task that eventually succeeded. Report a distribution with an explicit tail share, because agent cost is heavily skewed and the tail is usually a few pathological trajectories worth finding individually. And segment by task type: a blended average across a trivial classification and a multi-tool research task has no decision attached to it.
Latency needs the same treatment plus one agent-specific split: inference time versus time waiting on tools. Organizations instrumenting this for the first time frequently find external tool latency dominates, which redirects optimization from prompt tuning toward caching, parallelizing independent tool calls, and the slow internal API nobody owned.
Guardrails: When to Page, When to Halt
Observability that only produces dashboards is incomplete for agents, because agents take actions. The useful distinction is between halting and paging.
Halt automatically when the signal says the agent will not succeed and continuing costs money or risks harm: step budget exhausted, loop detected, repeated failures on a required tool, cost ceiling reached, or a policy violation on a proposed action. Halting is cheap and reversible: the agent stops, the task carries a termination reason, and the user gets a clear failure rather than a confident wrong answer.
Page a human only on aggregate signals: outcome-judge success below baseline for a task type, drift-flag rate rising, tool error rate spiking, ninety fifth percentile cost per task stepping up, or replay showing a post-deploy regression. Paging on individual trajectory failures is the fastest way to train a team to ignore agent alerts. A third path deserves explicit design: escalate to a human mid-task before a consequential irreversible action when confidence is low, as a first-class span with its own outcome so its rate and resolution quality stay measurable.
The Tooling Landscape
| Tool | Strength | Watch for |
|---|---|---|
| OpenTelemetry GenAI conventions | Open spec, not a product; portable schema over existing OTel collectors | Still evolving; track it rather than pin once |
| LangSmith | Fast path to traces and eval runs if already on the LangChain stack | Framework affinity; check export and schema portability |
| Langfuse | Open-source tracing, eval, prompt management; self-hosting answers data-residency objections | Self-hosting is an operational commitment, not free |
| Arize Phoenix | Open-source, strong OTel posture; traces plus embedding and drift analysis | Overlaps existing stacks; scope the boundary |
| Braintrust | Evaluation-first: eval workflow, dataset curation, candidate comparison | Evaluation-led, not tracing-led; pair with a trace backend |
| General APM (Datadog, Grafana stack, peers) | One pane of glass; the on-call team already lives there | GenAI evaluation depth lags the specialists |
The selection advice is narrower than the table suggests: instrument to the OpenTelemetry conventions first, then choose a backend, because that order keeps the decision reversible. Teams that pick a vendor first discover the switching cost is not the dashboard, it is every eval harness and alert built on that vendor's schema.
A Build Order for One Quarter
Each stage is useful on its own and depends on the one before it. Teams that jump to stage four fail, because evaluation without trajectory data produces scores nobody can act on. Weeks are indicative.
| Stage | Weeks | Deliverable | Done when |
|---|---|---|---|
| 1. Trajectory tracing | 1 to 2 | Trace per task, span per step, tool calls as spans, OTel attributes, termination reason | An engineer can open any production task and read what the agent did, in order, with tool inputs and outputs |
| 2. Cost and latency per task | 2 to 3 | Cost and steps per completed task by type, as a distribution with tail share; model versus tool time split | The team can state cost per resolved task and its ninety fifth percentile without a manual query |
| 3. Deterministic failure signals | 3 to 5 | Loop detection, unreferenced-result rate, budget exhaustion, per-tool error rates, halting on the hard ones | All four failure classes have a chart and a baseline, and halt conditions fire in production |
| 4. Outcome evaluation | 5 to 8 | Golden suite weighted to failure classes; outcome judge on a high production sample, gating CI | A prompt or model change is blocked by a measured drop in task success rather than shipped on a hunch |
| 5. Step evaluation and calibration | 8 to 10 | Step judges on failures and a sampled slice; human review of a stratified sample; published agreement rate | Failures localize to a step automatically, and judge agreement with human labels is a known number |
| 6. Production replay | 10 to 13 | Replay harness: recorded tool results, write-blocking, automated comparison | Every candidate change is evaluated against real production trajectories before it ships |
Stage six is where most programs stall, because it needs stage one's capture to have been complete enough, and teams routinely discover at week ten that they logged model messages but not tool results. Capturing tool inputs and outputs in stage one is nearly free at the start and expensive to retrofit.
What This Does Not Solve
- Badly specified tasks. Much of what gets diagnosed as goal drift is an underspecified task contract, and no amount of tracing fixes an instruction two reasonable readers would interpret differently.
- Judge reliability. Judges are models: they drift when the judge model is updated, they prefer longer and more confident-sounding output, and an uncalibrated judge reports in unknown units. The mitigation is the human-review row above, run continuously rather than once.
- Data governance. Traces hold prompts, retrieved context, and tool inputs and outputs, frequently the exact customer data the rest of the architecture is careful with. Redaction, retention, and access control belong in stage one, not in a ticket after the first audit question.
- Tooling maturity. Conventions are still moving and any product recommendation has a short shelf life, which as of the week of August 24, 2026 remains the argument for instrumenting to an open convention and treating the backend as replaceable.
Frequently Asked Questions
What is the difference between LLM observability and agent observability?
LLM observability instruments a single request and response: prompt, completion, tokens, latency, errors. Agent observability instruments a whole multi-step task as one trace, each step a nested span and tool calls first-class spans. The distinction matters because the agent-specific failures, wrong tool selection, silent loops, goal drift, and budget blowout, are properties of the step sequence and invisible per call.
Do I need a specialized agent observability tool, or can I use my existing APM?
Both work, and sequencing matters more than the choice. Instrument to the OpenTelemetry GenAI conventions first, which lets you emit trajectory data into any OTel-compatible backend including your current APM. Add a specialist tool when you need evaluation depth: judge orchestration, dataset curation, and production replay are where dedicated platforms lead today.
How much production traffic should I evaluate with an LLM judge?
Use asymmetric sampling rather than one rate. Deterministic checks such as schema validation, tool success, and budget exhaustion run on every trace because they are effectively free. Outcome judges run on a high sample at one call per trace. Step judges, at one call per span, run on failures, flagged traces, and a small random sample. That keeps evaluation cost proportional to the information it returns.
What does replaying production trajectories mean in practice?
It means re-running real captured trajectories against a candidate change and comparing outcomes pair by pair. It requires capture complete enough to reconstruct the run including tool inputs and outputs, recorded tool results for reads with writes hard-blocked, and automated comparison. Replay is the most reliable pre-deploy signal for agents because its coverage comes from production rather than what a test author imagined.
Why is cost per call the wrong metric for agents?
Because it improves when an agent takes more cheap steps, when it fails early and the retry counts as a new task, and when work is pushed to an escalation the metric never sees. Cost per completed task is the correct denominator: include failed attempts attributed to the task that eventually succeeded, report a distribution with its tail share, and segment by task type.
Related Articles
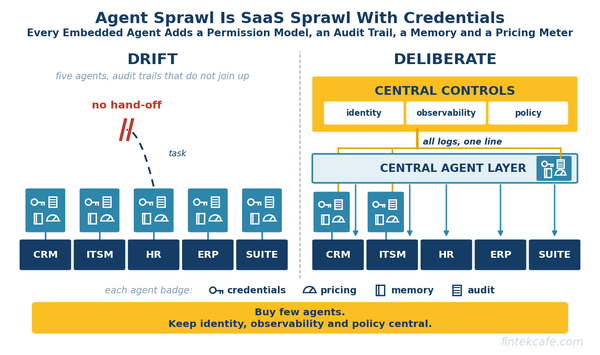
Every Software Vendor Now Sells an Agent, and Most Enterprises Should Buy Very Few of Them
Buying an agent from every system of record recreates SaaS sprawl one layer up. How CIOs should choose, and which controls must stay central.
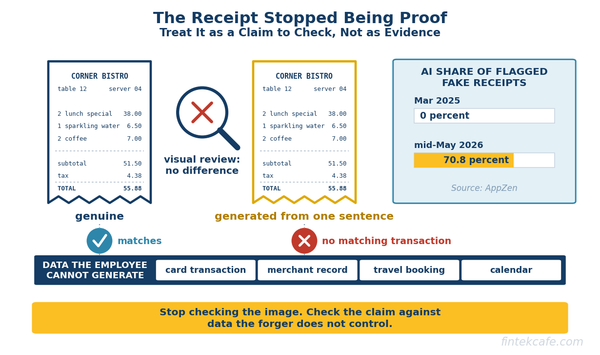
AI-Generated Fake Receipts: How Expense Fraud Changed and How Finance Teams Catch It
AI-generated fake receipts now beat visual review. How expense fraud changed, which detection still works, and the controls to use by company size.
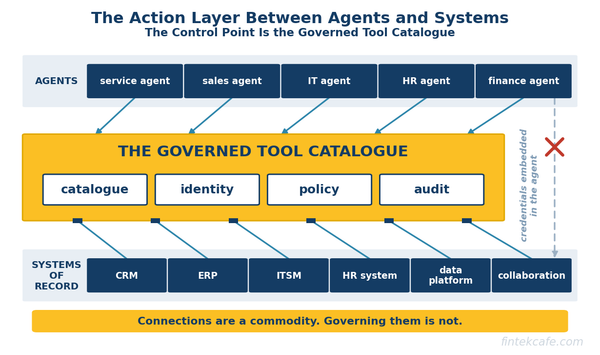
Integration Platforms Are the Quiet Winners of the Agent Era
Agents act through integrations. iPaaS and API vendors hold the connectors, credentials and audit trails, and MCP makes governing that layer worth more.