
How Fintech Companies Get Valued: Revenue Multiples and What Investors Look For

In August 2021, Stripe raised at a $95 billion valuation. In March 2023, it raised again - at $50 billion, a 47% decline. By February 2024, Stripe's 409A valuation had recovered to $65 billion. In early 2025, secondary market transactions reportedly valued the company above $90 billion again.
Nothing about Stripe's business broke during that journey. Revenue kept growing. Payment volume kept increasing. The product got better. What changed was the market's willingness to assign high multiples to future revenue - the interest rate environment shifted, comparable public companies repriced, and investors recalibrated what they would pay for growth.
This is the central reality of fintech valuation: the metrics matter, but the multiples are set by market conditions, investor sentiment, and comparable company pricing. Understanding both - the intrinsic quality metrics and the extrinsic market dynamics - is essential for anyone building, investing in, or competing with fintech companies.
The Great Repricing: 2021 to 2024
The fintech valuation environment of 2021 was extraordinary by any historical standard. Near-zero interest rates, massive fiscal stimulus, and a surge in digital adoption during COVID-19 created conditions where investors paid unprecedented premiums for growth.
| Company | Peak Market Cap (2021) | Trough Market Cap (2022-2023) | Market Cap (Early 2025) | Peak-to-Trough Decline |
|---|---|---|---|---|
| PayPal | $361 billion (Jul 2021) | $51 billion (Oct 2023) | ~$75 billion | -86% |
| Block (Square) | $124 billion (Aug 2021) | $26 billion (Oct 2023) | ~$40 billion | -79% |
| Affirm | $48 billion (Nov 2021) | $3.4 billion (Jan 2023) | ~$18 billion | -93% |
| Marqeta | $18 billion (Sep 2021) | $2.8 billion (Dec 2022) | ~$4 billion | -84% |
| Coinbase | $86 billion (Nov 2021) | $7.5 billion (Jan 2023) | ~$55 billion | -91% |
Sources: Company filings, market data. Market caps approximate based on closing prices.
These declines were not primarily driven by operational deterioration. PayPal's revenue grew from $25.4 billion in 2021 to $29.8 billion in 2023. Block's gross profit grew over the same period. Affirm's GMV increased substantially. The stocks declined because the multiples compressed - investors were no longer willing to pay 15-20x revenue for companies growing at 20-30%.
The trigger was the Federal Reserve's interest rate cycle. When the Fed began raising rates aggressively in March 2022, the discount rate applied to future cash flows increased, and the present value of distant future profits declined. High-growth, low-profit companies - which characterized most of the fintech sector - were disproportionately affected because so much of their value was predicated on future earnings rather than current profitability.
Revenue Multiples: Why They Vary So Widely
The most common valuation metric for fintech companies is the enterprise value to revenue multiple (EV/Revenue). As of early 2025, the range across the fintech sector is enormous.
| Company | EV/Revenue (Early 2025) | Revenue Growth (YoY) | Operating Margin | Business Model |
|---|---|---|---|---|
| Visa | ~16x | ~10% | ~67% | Network (toll model) |
| Mastercard | ~17x | ~11% | ~57% | Network (toll model) |
| Adyen | ~13x (net revenue) | ~22% | ~46% | Payment processor |
| Affirm | ~7x | ~40% | Negative | BNPL / lending |
| PayPal | ~2.5x | ~6% | ~16% | Payment processor |
| Block | ~2x | ~10% (gross profit) | ~4% | Payments + financial services |
| SoFi | ~4x | ~25% | Breakeven | Neobank + lending |
Sources: Company filings and market data as of early 2025. Multiples approximate.
Visa trades at 16x revenue. PayPal trades at 2.5x. Both are payments companies. Why is there a 6x difference?
The answer lies in five factors that drive valuation multiples: revenue quality, margin structure, competitive moat, growth durability, and regulatory risk.
This is a Premium Article
Sign up for a Premium membership to read this article and get full access to strategic intelligence on technology and business.
Already a member? Sign in
Related Articles
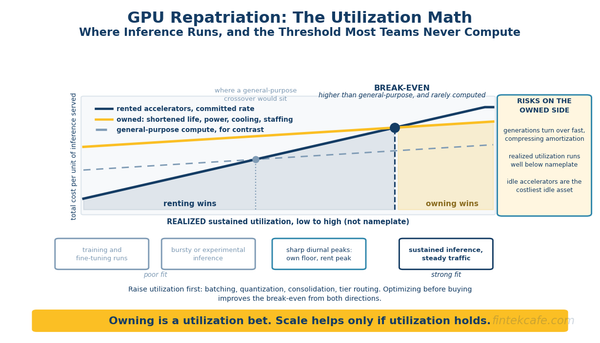
GPU Repatriation: The Utilization Math Deciding Where Inference Runs
Owned accelerators beat rented ones above a utilization threshold most teams never compute. The break-even math, and why idle GPUs are the expensive asset.
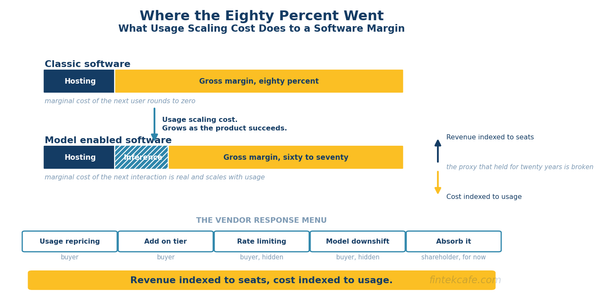
The SaaS Gross Margin Squeeze: AI COGS Are Breaking the Eighty Percent Model
Inference is a real, usage-scaling cost of goods sold. It is pulling software gross margins toward infrastructure territory, and buyers pay for it either way.

Trade Finance Explained: Letters of Credit, Factoring, and Supply Chain Finance
The $5 Trillion Infrastructure Nobody Talks About Every iPhone assembled in Zhengzhou, every container of Brazilian soybeans unloaded in Rotterdam, every batch of Vietnamese electronics shipped