The Executive's Guide to Cloud Costs: Why Your Bill Is 40% Too High
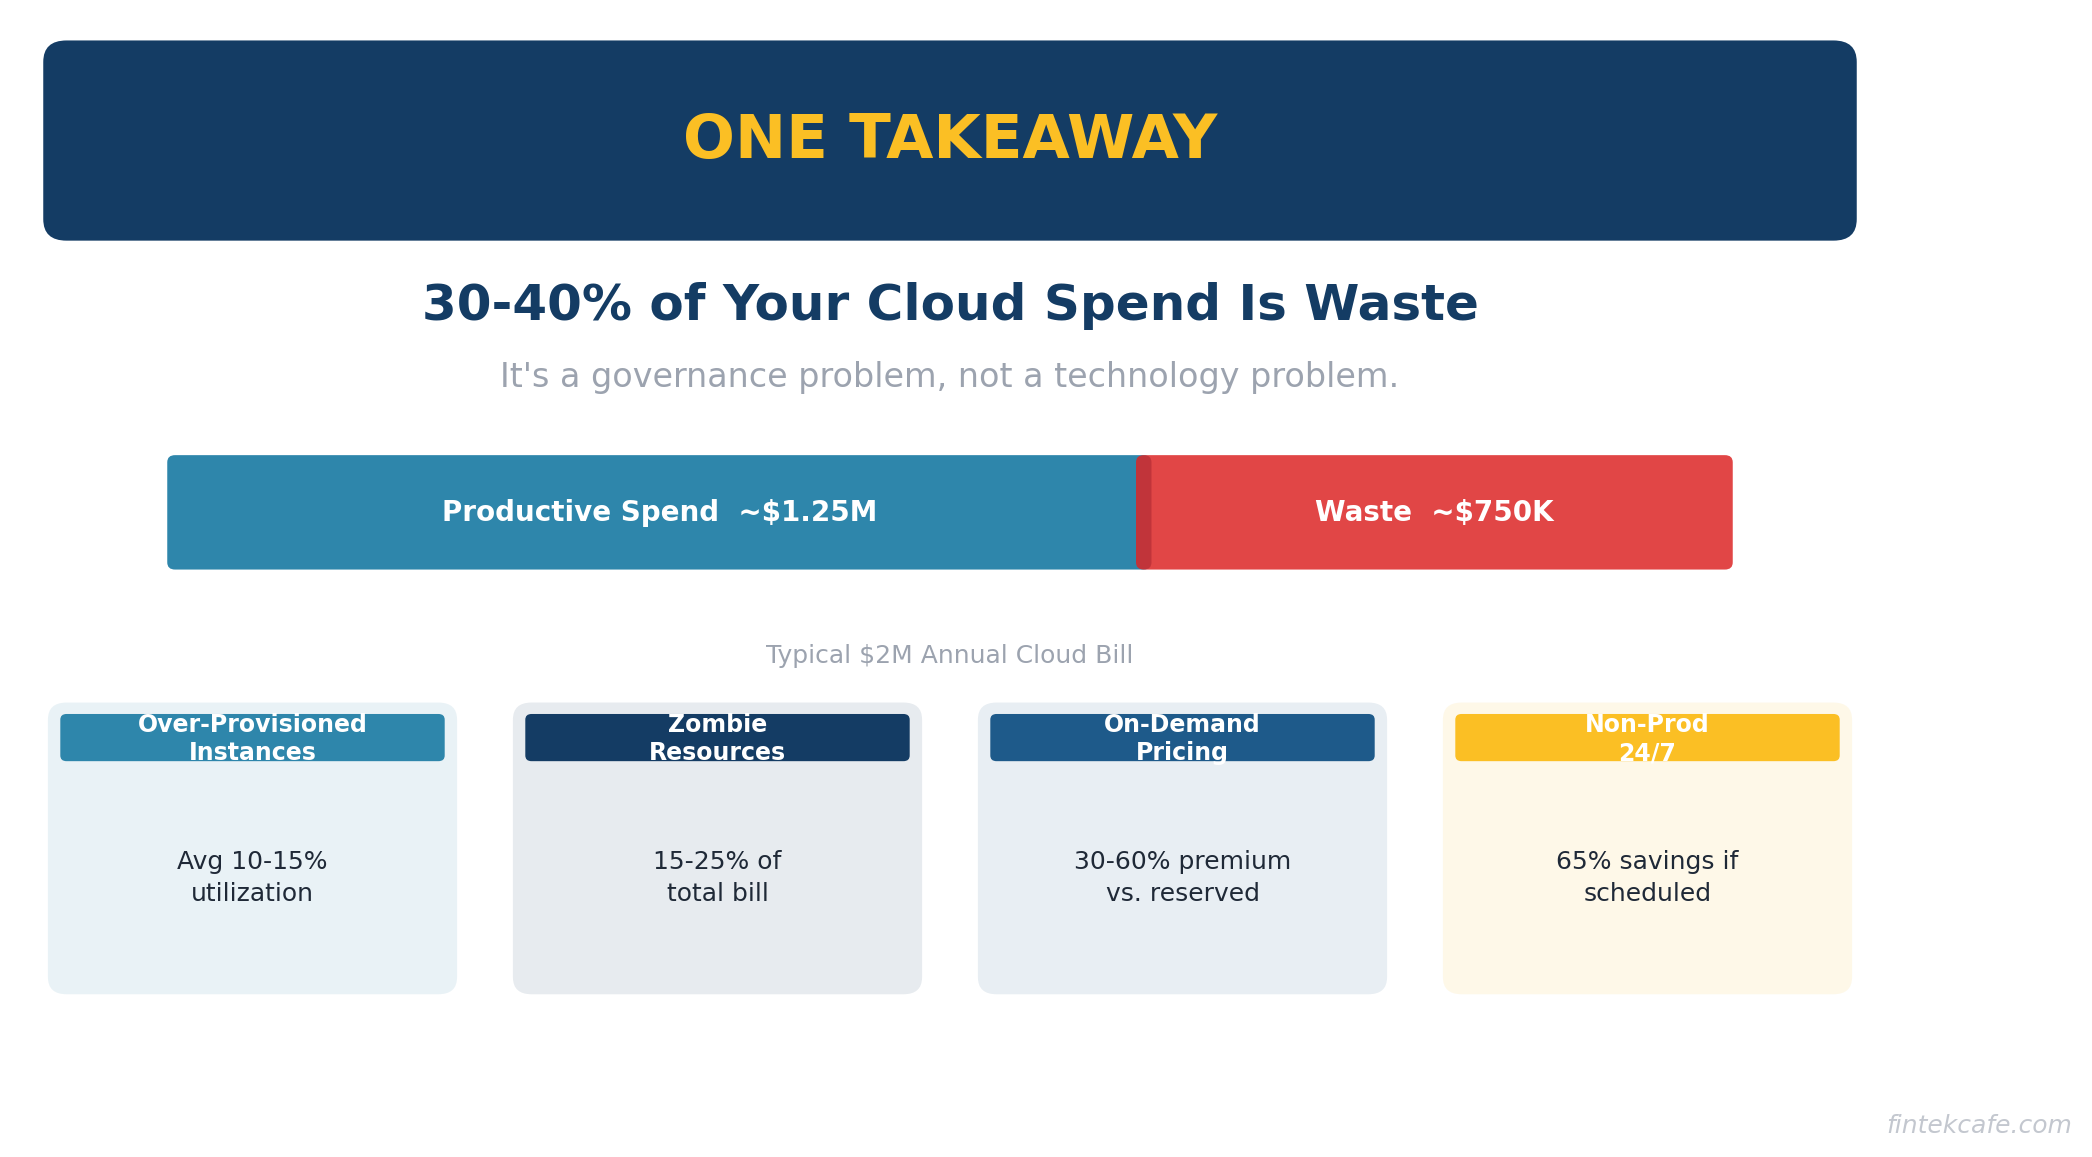
Your company is almost certainly spending more on cloud than it needs to. Not 5% more. Not 10% more. Industry research consistently shows that organizations waste 30-40% of their cloud spend.
For a company spending $2M a year on AWS, Azure, or Google Cloud, that is $600K to $800K going to resources nobody is using, instances nobody remembers provisioning, and pricing tiers nobody has optimized.
This is not an engineering problem. It is a financial governance problem. And it requires executive attention to fix.
This guide explains why cloud bills spiral out of control, how to identify the biggest sources of waste, and what to do about it. It includes a checklist you can hand to your CTO on Monday morning and a framework for building ongoing cloud cost governance into your organization.
Why Cloud Costs Spiral Out of Control
Cloud computing was supposed to save money. Pay only for what you use. No more buying servers that sit idle. Scale up when you need to, scale down when you do not.
The theory is sound. The practice is very different. Here is why.
The Ease of Provisioning
In a traditional data center, buying a server required a purchase order, budget approval, procurement, shipping, and physical installation. The friction was frustrating but it served as a natural cost control. Nobody provisioned a server they did not need because the process was too painful.
In the cloud, provisioning a new server takes 30 seconds and a few clicks. An engineer spins up a large instance to test something on Friday. By Monday, they have moved on to another task. The instance runs for months. Nobody notices because no single instance is large enough to trigger an alert, but multiply this across dozens of engineers and hundreds of instances and the waste compounds.
Over-Provisioning as the Default
When engineers size cloud resources, they estimate what they need — and then add a safety margin. Often a large one. A workload that needs 4 CPUs gets provisioned with 8. A database that uses 50GB of storage gets allocated 500GB. Memory, compute, and storage all get rounded up because under-provisioning causes outages and over-provisioning only costs money.
This instinct is rational from an engineering perspective. Downtime is visible and painful. Waste is invisible. Nobody gets paged at 2 AM because a server is too big.
Studies consistently find that the average cloud instance runs at 10-15% utilization. That means 85-90% of the compute power you are paying for is sitting idle at any given moment.
Zombie Resources
Zombie resources are cloud assets that no longer serve any purpose but continue to run and generate charges. They include:
- Test environments that were never shut down after the test completed
- Old application versions running alongside new ones because nobody confirmed it was safe to decommission them
- Snapshots and backups of systems that no longer exist
- Load balancers pointing to nothing
- Unattached storage volumes left behind when instances were terminated
- IP addresses allocated but not assigned to anything
In most organizations, zombie resources account for 15-25% of the total cloud bill. They are the easiest source of waste to eliminate — if someone is looking for them.
No Spending Accountability
In many organizations, cloud costs land in a single IT budget line item. Nobody owns the cost at a granular level. The engineering team spins up resources. The finance team pays the bill. Neither has the incentive or the visibility to optimize.
When a marketing team buys software, there is a purchase order and a budget owner. When an engineering team provisions $50K worth of cloud infrastructure, it often happens without any approval process at all.
Pricing Complexity
AWS alone has over 300 services and millions of pricing combinations. The pricing pages for a single service can run thousands of words. Azure and Google Cloud are similarly complex.
This complexity is not accidental. Cloud vendors benefit when customers do not fully understand pricing. The default pricing (on-demand) is always the most expensive option. Cheaper options (reserved instances, savings plans, spot instances) require commitment, planning, and ongoing management.
Most companies stay on the most expensive pricing tier simply because nobody has the time or expertise to optimize.
The Real Numbers: Where Your Money Goes
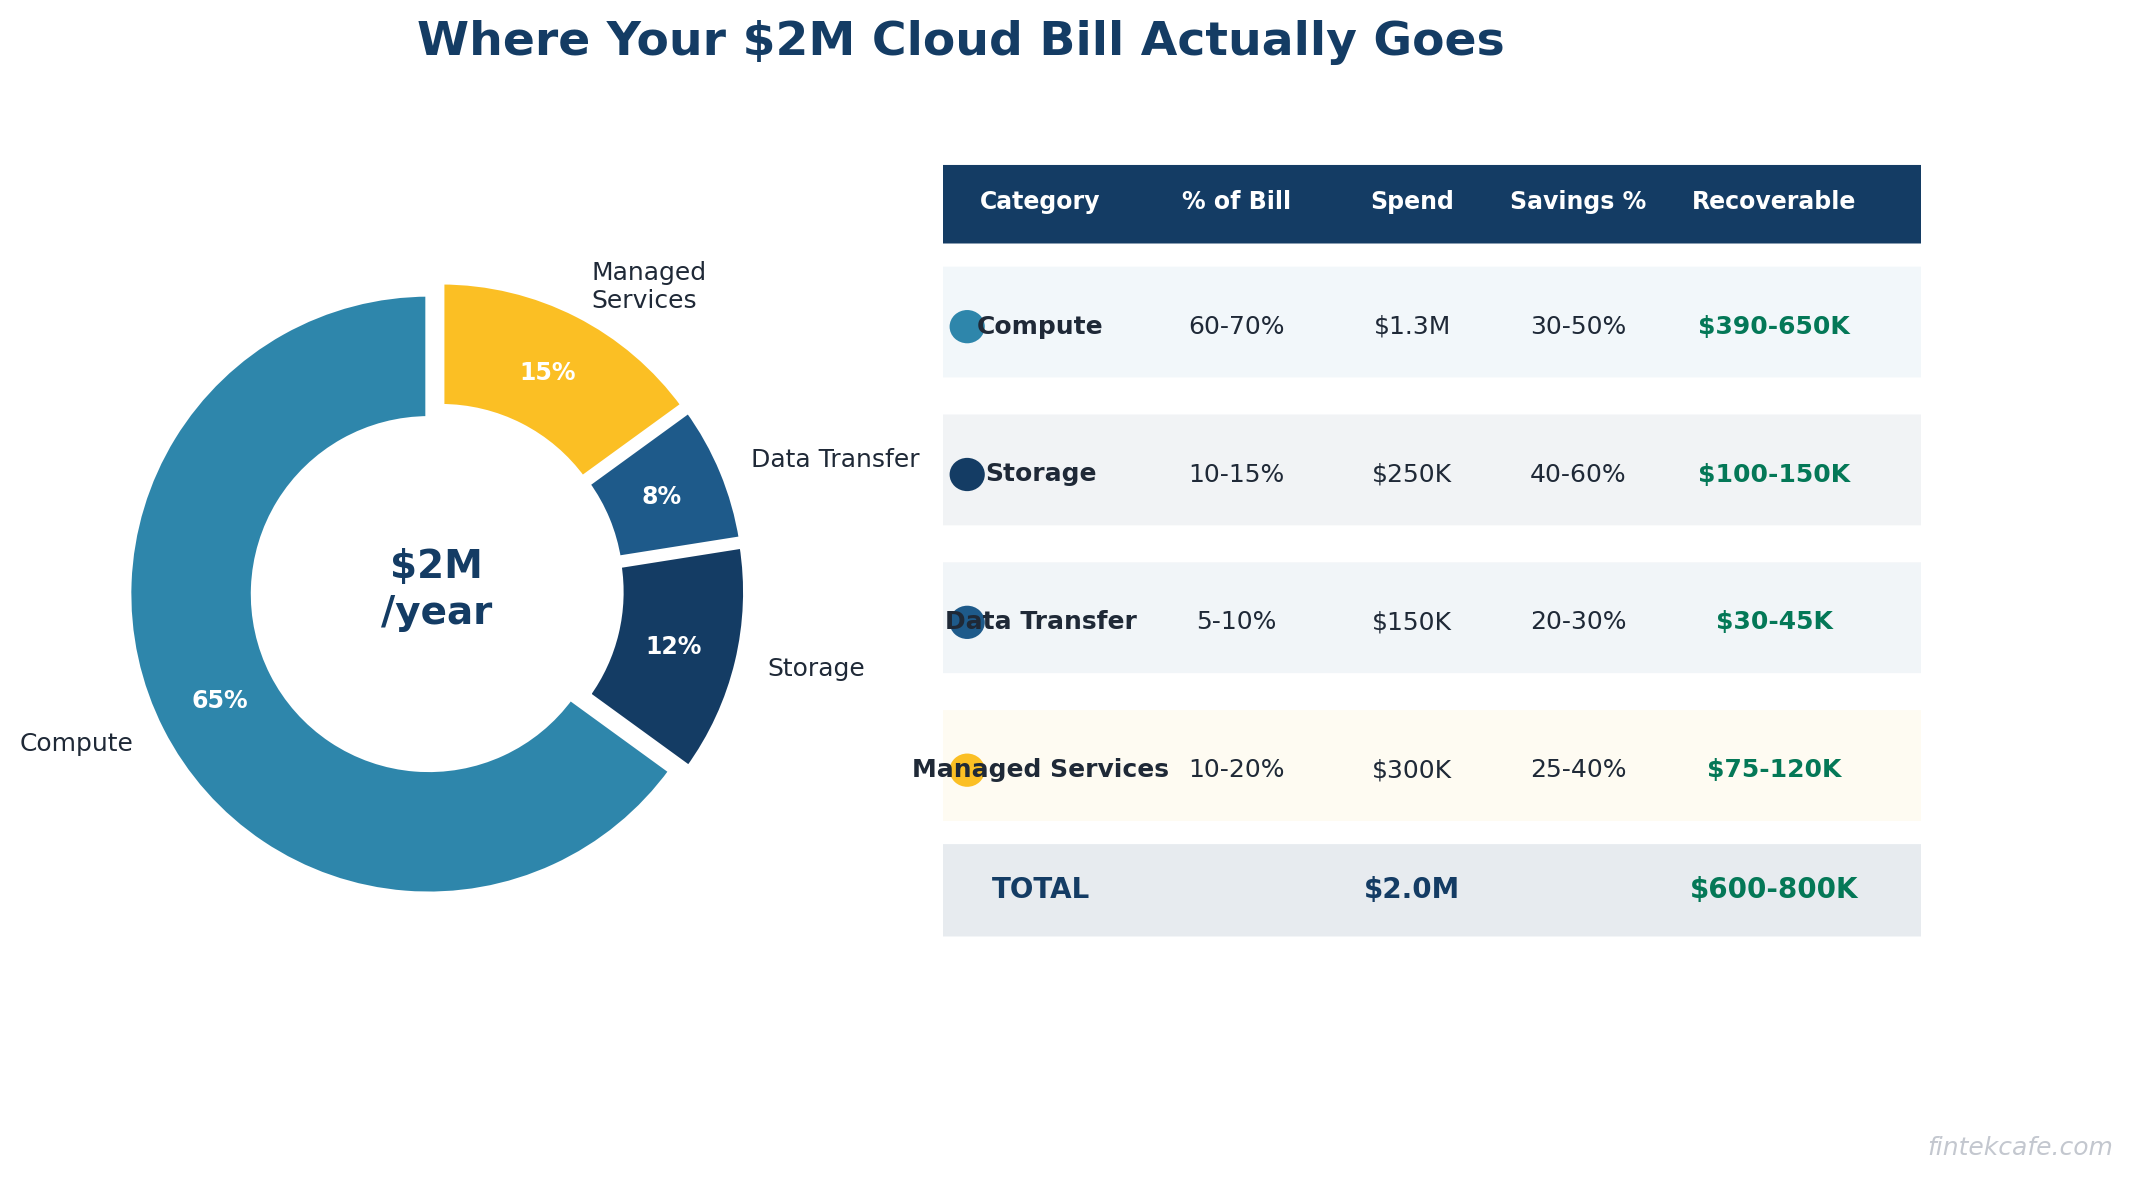
Let us break down a typical $2M annual cloud bill and identify where waste hides.
Compute: 60-70% of Total Spend
Virtual machines and containers are the largest cost category. The primary sources of waste:
- Right-sizing opportunities. The average instance is 2-3x larger than needed. Downsizing from a large instance to a medium instance cuts the cost in half with no performance impact for most workloads.
- On-demand pricing. Reserved instances or savings plans can reduce compute costs by 30-60% for predictable workloads. If you are running the same servers 24/7 on on-demand pricing, you are paying a significant premium.
- Idle instances. Development and staging environments that run 24/7 but are only used during business hours. Shutting them down outside working hours saves 65% of their cost.
Typical savings: 30-50% of compute spend
Storage: 10-15% of Total Spend
Storage costs grow over time because data accumulates and nobody deletes anything. The waste comes from:
- Wrong storage tier. Data that has not been accessed in 90 days sitting in high-performance storage instead of archive storage. The cost difference can be 80%.
- Redundant snapshots. Automated snapshot policies that create daily backups kept for years. Do you need 365 snapshots of a development database?
- Orphaned volumes. Storage volumes that were attached to instances that no longer exist. They cost money every month and serve no purpose.
Typical savings: 40-60% of storage spend
Data Transfer: 5-10% of Total Spend
Cloud vendors charge for data moving between regions, between services, and out to the internet. Data transfer costs are notoriously difficult to predict and optimize. Common waste:
- Cross-region traffic between services that could be in the same region
- Redundant data movement where the same data is transferred multiple times
- No CDN for content that could be cached at the edge
Typical savings: 20-30% of data transfer spend
Managed Services: 10-20% of Total Spend
Managed databases, message queues, search clusters, and other services. Waste patterns mirror compute: over-provisioned, running on expensive tiers, with unused capacity.
Typical savings: 25-40% of managed services spend
The Total Opportunity
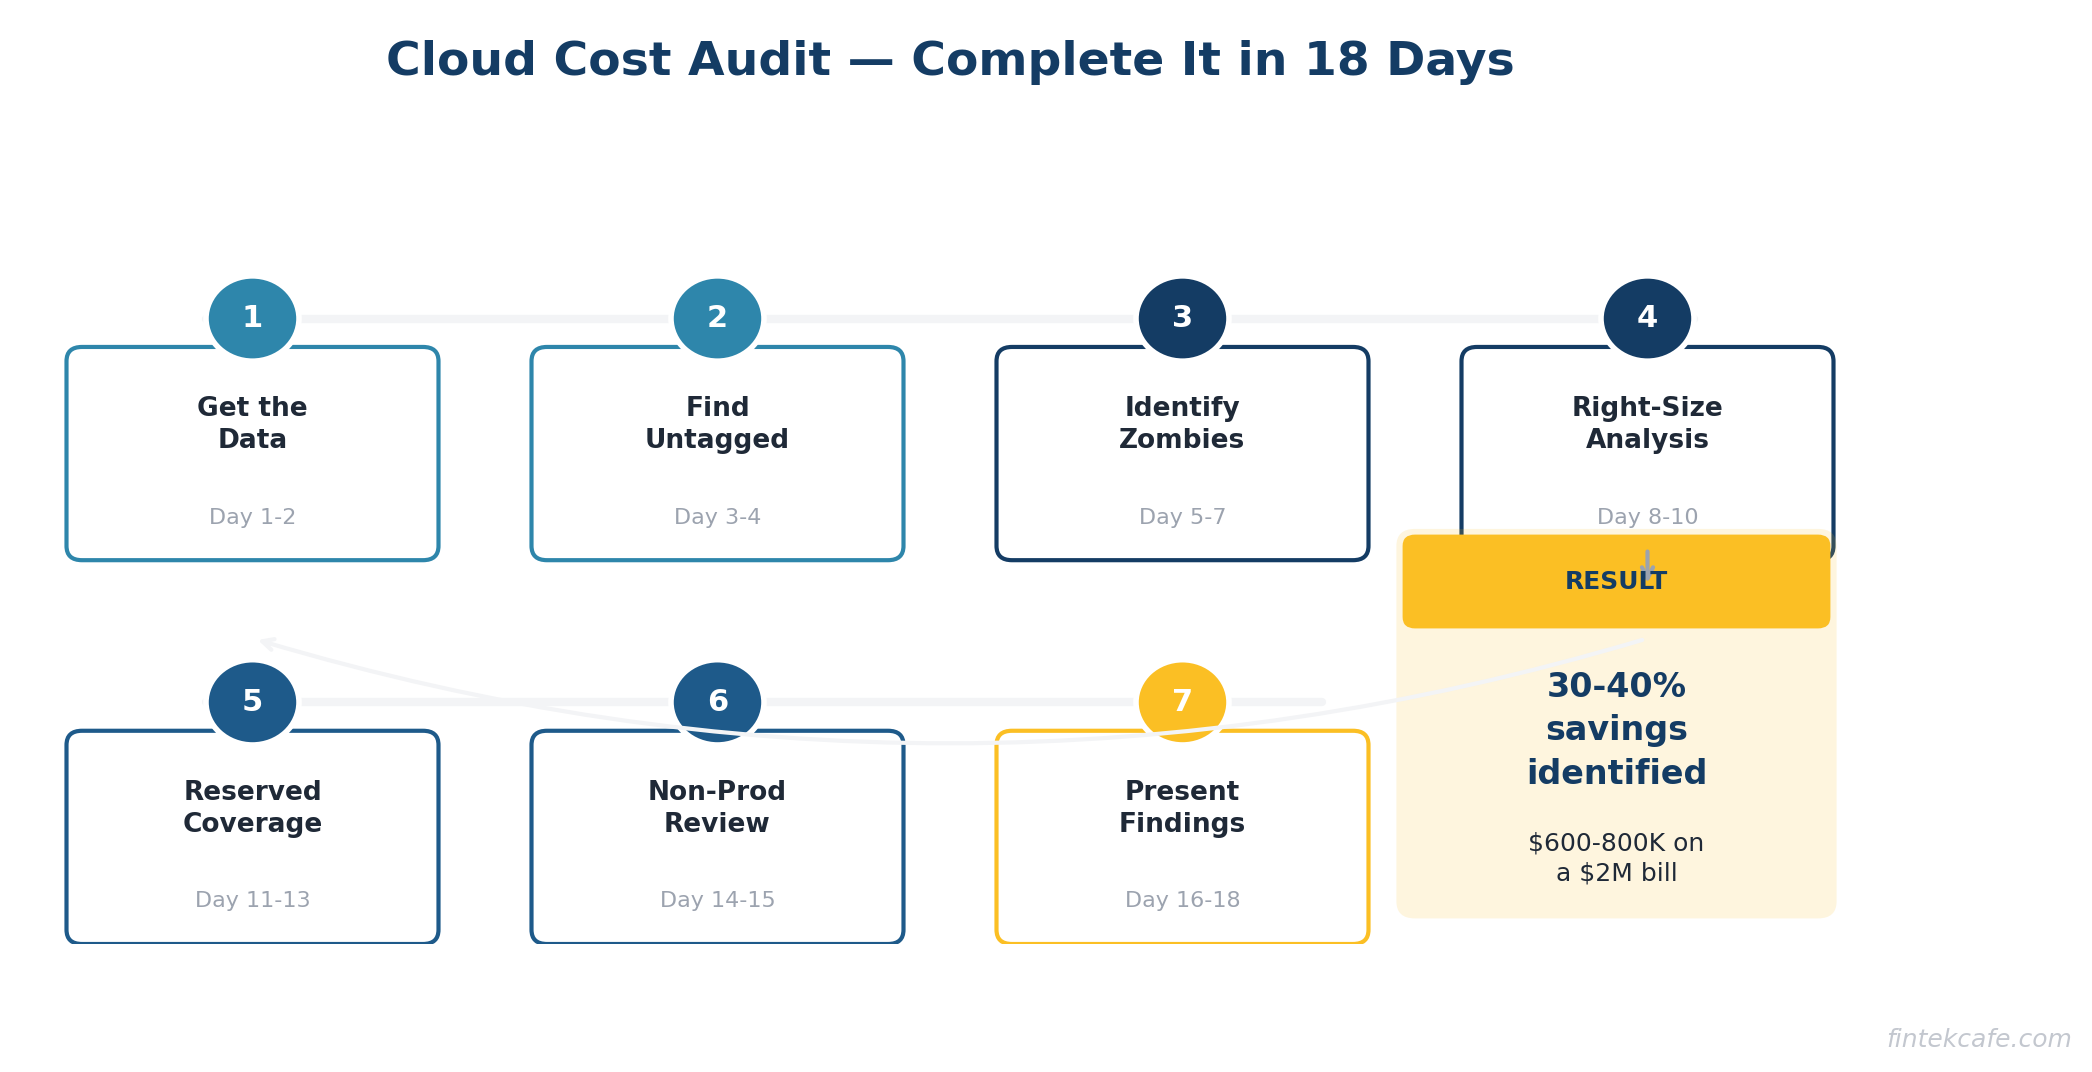
For a $2M annual cloud bill, a disciplined optimization effort typically finds $600K to $800K in annual savings. For larger bills, the absolute savings grow proportionally. A $10M cloud bill commonly has $3-4M in optimization opportunity.
The FinOps Framework
FinOps — short for Financial Operations — is the practice of bringing financial accountability to cloud spending. It has emerged as the standard approach for organizations serious about managing cloud costs.
The core principle is simple: the people who spend money on cloud need visibility into what they are spending, and they need to be accountable for it.
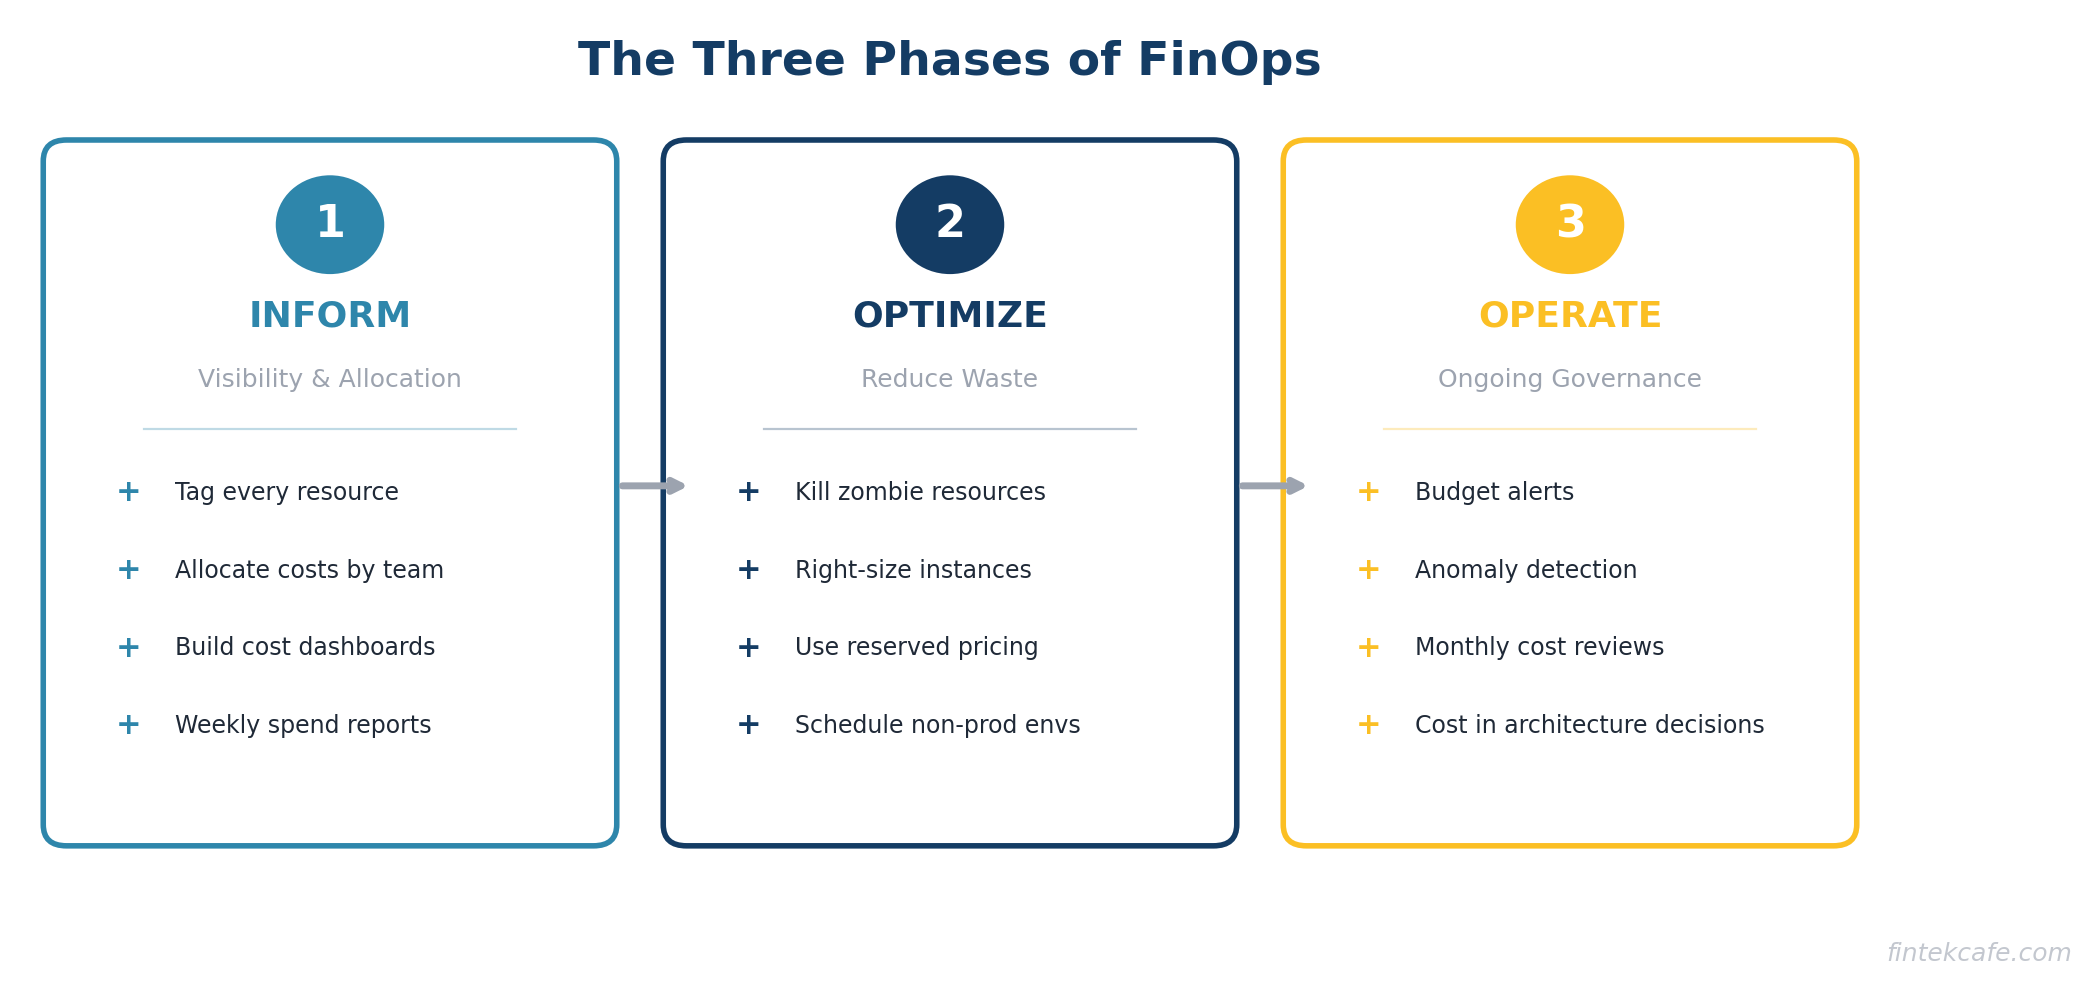
The Three Phases of FinOps
Phase 1: Inform
Before you can optimize, you need visibility. This means:
- Tagging everything. Every cloud resource gets tagged with the team, project, and environment it belongs to. Without tags, you cannot allocate costs to the teams that incur them.
- Cost allocation. Break the cloud bill down by team, project, and environment. Show each engineering team what they are spending.
- Dashboards. Make cost data visible and accessible. A weekly email showing each team's spend vs. budget is a simple starting point.
Most organizations that have never done FinOps will find that 30-50% of their cloud resources are untagged and cannot be attributed to any team or project. Fixing this is step one.
Phase 2: Optimize
With visibility in place, start reducing waste:
- Eliminate zombie resources. The fastest wins. Shut down anything that is not being used.
- Right-size instances. Downsize over-provisioned resources based on actual utilization data.
- Use reserved pricing. Commit to reserved instances or savings plans for stable workloads.
- Schedule non-production environments. Turn off development and staging environments outside business hours and on weekends.
- Optimize storage tiers. Move infrequently accessed data to cheaper storage classes.
Phase 3: Operate
Build ongoing governance to prevent cost regression:
- Budget alerts. Automatic notifications when spending exceeds thresholds.
- Anomaly detection. Alerts when spending patterns change unexpectedly.
- Regular reviews. Monthly cloud cost reviews with engineering leadership.
- Provisioning policies. Guidelines and guardrails for how engineers provision resources.
- Cost as a design constraint. Include cost implications in architecture decisions, not just performance and reliability.
Reserved Instances vs. On-Demand: The Economics
This is the single highest-impact optimization for most companies. Understanding it requires no technical knowledge — it is a straightforward financial decision.
On-Demand Pricing
You pay by the hour (or second) with no commitment. This is the default. It is also the most expensive option. Think of it as the walk-up rate at a hotel.
Reserved Instances (or Savings Plans)
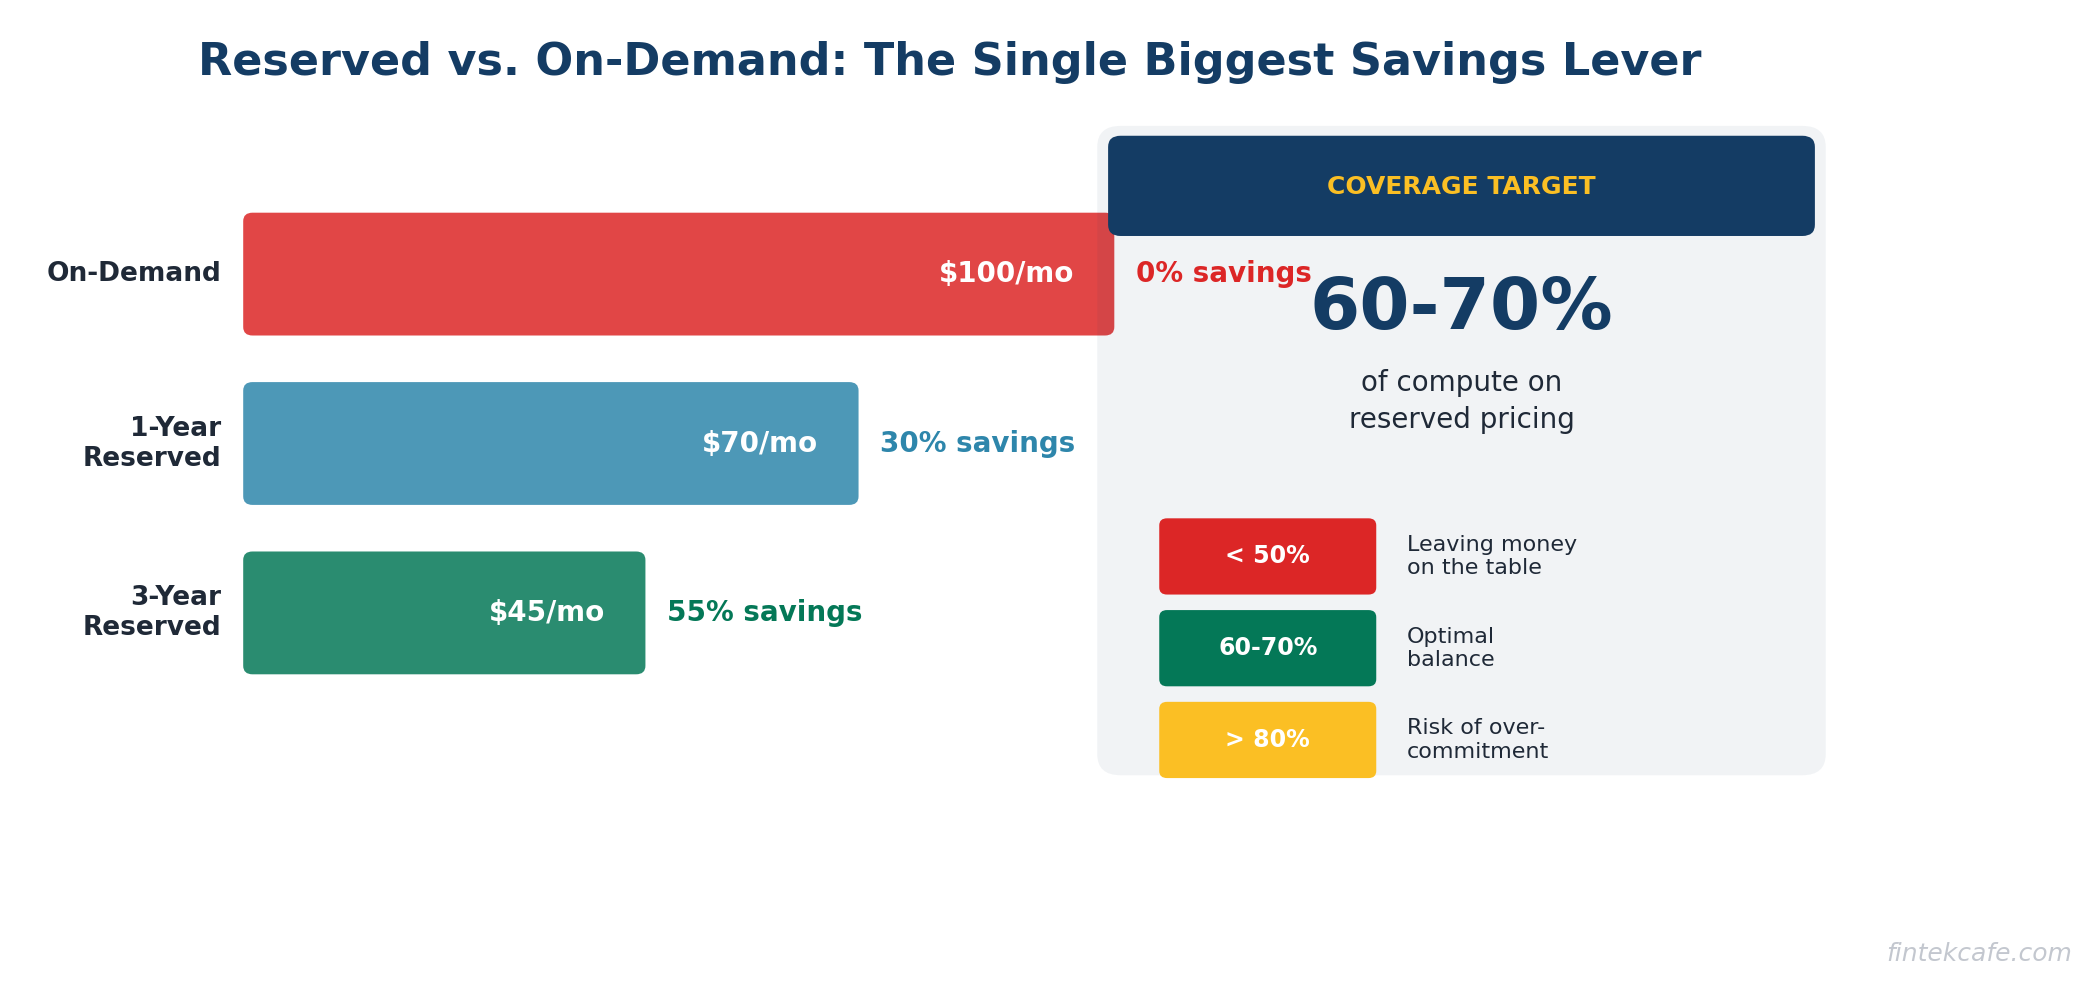
You commit to using a certain amount of compute for one or three years. In exchange, you get a 30-60% discount. Think of it as a long-term lease vs. paying nightly rates.
The math is simple:
An on-demand instance costs $100/month. A one-year reserved instance costs $70/month (30% savings). A three-year reserved instance costs $45/month (55% savings).
If you have workloads that run 24/7 and will continue running for the next year, there is no reason to pay on-demand rates. The savings are guaranteed the moment you commit.
The risk:
If your workload changes and you no longer need the instance, you still pay for the reservation. This is why reserved pricing works best for stable, predictable workloads — production databases, core application servers, infrastructure services. It is not appropriate for experimental workloads or instances that may not be needed in six months.
A practical approach:
Start by identifying workloads that have run consistently for the past six months with no plans to change. Reserve those first. This is low-risk, high-reward. Over time, expand coverage as you gain confidence in forecasting.
Most organizations should aim for 60-70% reserved coverage on their compute spend. Below 50% means you are leaving significant money on the table. Above 80% means you may be over-committed and risk paying for unused reservations.
How to Run a Cloud Cost Audit
Here is a step-by-step process for auditing your cloud costs. You can run this in two to three weeks with one engineer and one finance person.
Step 1: Get the Data (Day 1-2)
Pull your cloud billing data for the past six months. Every major cloud provider has a cost explorer or billing dashboard. Export the data to a spreadsheet or business intelligence tool. You want to see spending by:
- Service (compute, storage, database, etc.)
- Region
- Account or project
- Tag (team, environment, application)
- Month over month trend
Step 2: Find the Untagged Resources (Day 3-4)
Identify every resource that is not properly tagged. These are your blind spots. You cannot optimize what you cannot attribute. Create a task force to tag everything within two weeks. No exceptions.
Step 3: Identify Zombie Resources (Day 5-7)
Look for:
- Instances with less than 5% average CPU utilization over 30 days
- Storage volumes not attached to any instance
- Load balancers with no healthy targets
- IP addresses not associated with running instances
- Snapshots older than 90 days for non-production systems
- Instances in stopped state for more than 30 days (you still pay for attached storage)
Create a list. Share it with the responsible teams. Give them one week to confirm which resources can be terminated. Then terminate them.
Step 4: Analyze Right-Sizing Opportunities (Day 8-10)
Pull utilization data for your top 50 most expensive instances. For each one, look at average and peak CPU, memory, and network utilization over the past 30 days.
If average utilization is below 20% and peak utilization is below 50%, the instance is a candidate for downsizing. Start with a recommendation to drop one size (e.g., xlarge to large). This typically cuts the cost in half.
Step 5: Evaluate Reserved Instance Coverage (Day 11-13)
Calculate what percentage of your compute spend is on reserved pricing vs. on-demand. If you are below 50% reserved coverage, there is a significant optimization opportunity. Identify the stable workloads that should be converted first.
Step 6: Review Non-Production Environments (Day 14-15)
List all development, staging, QA, and test environments. For each one:
- Is it needed at all? If the project is complete, shut it down.
- Does it need to run 24/7? If not, implement scheduling to shut down outside business hours.
- Is it sized appropriately? Non-production environments almost never need production-sized resources.
Step 7: Present Findings and Build a Roadmap (Day 16-18)
Compile your findings into a simple report:
- Total annual cloud spend
- Estimated waste (with breakdown by category)
- Quick wins (can implement this week)
- Medium-term optimizations (require planning, 30-60 days)
- Long-term governance changes (ongoing)
Present this to the CTO and CFO together. Cloud cost optimization requires both technical execution and financial oversight.
The Checklist for Your CTO
Print this out and hand it over. These are the questions that need answers.
Visibility:
- [ ] What is our total monthly cloud spend, broken down by team?
- [ ] What percentage of our cloud resources are properly tagged?
- [ ] Do we have cost dashboards that engineering teams can access?
- [ ] Are there budget alerts set up for each team or project?
Waste Elimination:
- [ ] When was the last time we audited for zombie resources?
- [ ] How many instances are running at less than 20% average utilization?
- [ ] Are non-production environments running 24/7? If so, why?
- [ ] Do we have snapshots and backups older than our retention policy?
Pricing Optimization:
- [ ] What percentage of our compute is on reserved pricing vs. on-demand?
- [ ] Have we evaluated savings plans or committed use discounts?
- [ ] Are we using the cheapest storage tier appropriate for each data set?
- [ ] Have we evaluated spot instances for fault-tolerant workloads?
Governance:
- [ ] Is there a process for reviewing and approving new cloud resources above a certain cost threshold?
- [ ] Do we conduct monthly cloud cost reviews with engineering leadership?
- [ ] Is cost a factor in architecture and design decisions?
- [ ] Who is accountable for cloud cost optimization?
If the answer to most of these questions is "I don't know" or "no," you have a governance gap — and almost certainly a spending problem.
Building a Cloud Cost Culture
Optimizing cloud costs once is not enough. Without ongoing governance, costs creep back up within six months. Here is how to build lasting discipline.
Assign Ownership
Appoint a FinOps lead or team. In smaller organizations, this can be a single engineer who spends 20% of their time on cost optimization. In larger organizations, a dedicated FinOps team of two to four people typically pays for itself many times over.
Make Costs Visible
Engineers cannot optimize what they cannot see. Give every team a dashboard showing their cloud spend. Send weekly cost reports. Make cost a topic in sprint retrospectives. When engineers see the dollar impact of their architecture decisions, behavior changes.
Set Budgets with Teeth
Allocate cloud budgets by team. Track spending against budget monthly. When a team exceeds budget, they should explain why and present a plan to correct. This is not about punishment. It is about accountability.
Include Cost in Architecture Reviews
Every architecture decision has a cost implication. A microservices architecture costs more to run than a monolith. A multi-region deployment costs more than single-region. These are valid trade-offs, but they should be conscious trade-offs with cost as an explicit factor.
Celebrate Wins
When a team reduces their cloud bill by 30%, recognize it. Share the story internally. Make cost optimization a point of pride, not just another mandate from management.
Key Takeaways
- Most organizations waste 30-40% of their cloud spend. For a $2M annual bill, that is $600K-$800K in recoverable waste.
- The biggest sources of waste are over-provisioned instances, zombie resources, on-demand pricing for stable workloads, and non-production environments running 24/7.
- Cloud cost optimization is a governance problem, not just a technical problem. It requires executive sponsorship, financial accountability, and ongoing discipline.
- Reserved instances or savings plans reduce compute costs by 30-60% for predictable workloads. If less than 50% of your compute is on reserved pricing, you are overpaying.
- Run a cloud cost audit in two to three weeks. Start with zombie resources and right-sizing — these deliver the fastest savings with the lowest risk.
- Build a FinOps practice with clear ownership, visible cost data, team-level budgets, and cost as a factor in architecture decisions.
- Hand the CTO checklist in this article to your technology leader. The answers will tell you how much opportunity exists.
Frequently Asked Questions
Is 30-40% waste really typical?
Yes. Multiple industry sources confirm this range. Gartner, Flexera, and other analysts consistently report that organizations waste one-third or more of their cloud spend. Companies that have never conducted a cost optimization effort are often at the higher end of this range.
Will reducing cloud spend hurt performance or reliability?
Not if done correctly. Right-sizing reduces costs by eliminating unused capacity, not by under-provisioning. Shutting down zombie resources has zero performance impact because nobody is using them. Reserved pricing delivers identical performance at a lower price. The optimizations in this guide target waste, not capability.
How long does it take to see savings?
Zombie resource elimination shows up on the next monthly bill. Right-sizing typically takes two to four weeks to implement and shows savings immediately. Reserved instance purchases deliver savings from day one of the commitment. Most organizations see 15-20% reduction in their cloud bill within 60 days of starting a serious optimization effort.
Should we use a third-party cloud cost optimization tool?
For organizations spending over $500K annually on cloud, a dedicated FinOps tool usually pays for itself. These tools automate resource discovery, identify waste, recommend right-sizing, and track savings. For smaller cloud bills, the native cost management tools from AWS, Azure, or Google Cloud are usually sufficient.
Does moving to a different cloud provider save money?
Rarely. Migration costs are significant, and pricing across the three major cloud providers is competitive. The optimization opportunity within your current provider almost always exceeds the savings from switching. Focus on optimizing your current environment before considering a migration.
Who should own cloud cost optimization — finance or engineering?
Both. This is the core insight of FinOps. Finance brings budgeting discipline, reporting, and accountability. Engineering brings the technical knowledge to implement changes. The FinOps lead should sit between both teams and speak both languages. In practice, the role often reports to the CTO or VP of Engineering with a dotted line to the CFO.
Internal Links
Related Articles
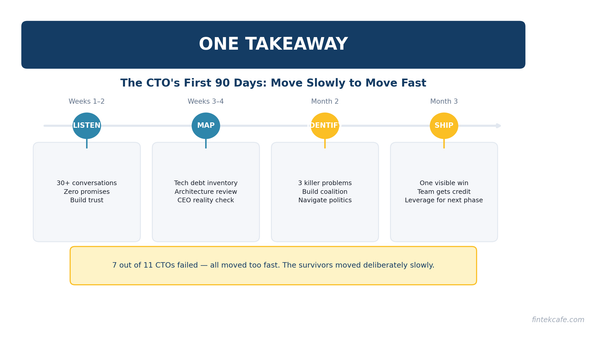
The CTO's First 90 Days: What Actually Matters
An opinionated playbook for new CTOs. Most fail because they change too much too fast. Here's the week-by-week approach that actually works.
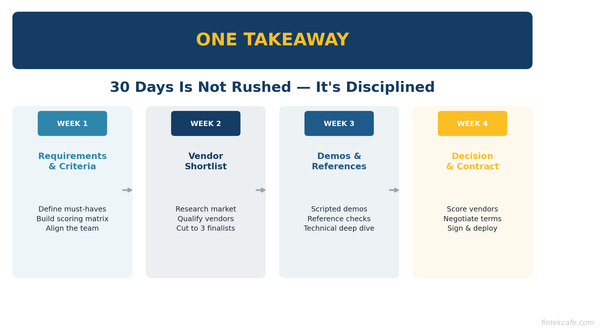
How to Run an Enterprise Software Evaluation in 30 Days
A 30-day framework for evaluating enterprise software. Includes vendor questions, red flags, negotiation tactics, and a total cost of ownership checklist.
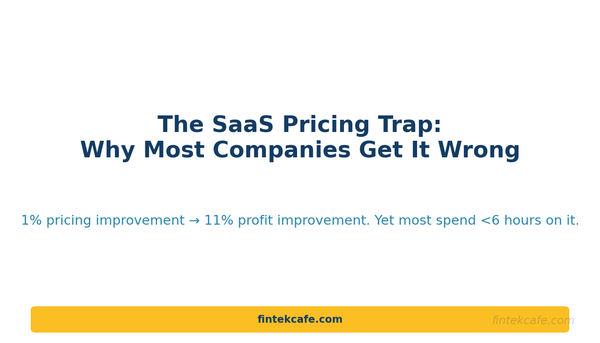
The SaaS Pricing Trap: Why Most Companies Get It Wrong
Per-seat pricing is dying, usage-based creates volatility, and most SaaS companies underprice by 30-50%. Pricing is the most underinvested function in tech.